
Is Senior Housing a Good Investment? What the Data Shows

September 30, 2026
Updated: October 1, 2026
- Senior housing returned 10.6% in the NCREIF Property Index for 2025, the highest of any property type. The Expanded NPI returned 4.9%.
- Over three, 10 and 20 years, senior housing outperformed the broader index.
- Both income (5.6%) and appreciation (4.8%) drove the 2025 result. Appreciation across the index as a whole was 0.2%.
- Closed transaction volume reached $15.1 billion in 2025, more than double the $7.3 billion recorded in 2023 and the highest annual total in NIC MAP’s series.
Senior housing asks more of investors than most commercial real estate. An owner underwrites a building and an operating business at the same time, and returns depend on occupancy, staffing and expense control as much as on the real estate itself. During the pandemic period, that operating exposure made the investment case harder to defend. Labor and operating expenses climbed sharply, construction lenders pulled back and higher borrowing costs repriced commercial property across every sector. For investors already holding assets, and those weighing entry, the question has become direct: is senior housing a good investment going forward?
On the data, senior housing has performed well. It delivered a 10.6% total return in 2025, according to NCREIF, the highest of any property type in the index, and it outperformed the index over three-, 10- and 20-year periods. Closed transaction volume reached $15.1 billion in 2025, per NIC MAP data. The answer for any single portfolio still depends on strategy, cost of capital and hold period.
Two sources establish that record. Private-market returns tracked by NCREIF show what senior housing has delivered compared with other property types. NIC MAP transaction data shows whether buyers are acting on that performance.
How Has Senior Housing Performed Against Other Property Types?
Senior housing has outperformed the broader NCREIF Property Index (NPI) over most measured periods. The 2025 margin was the widest of any period in the table below.
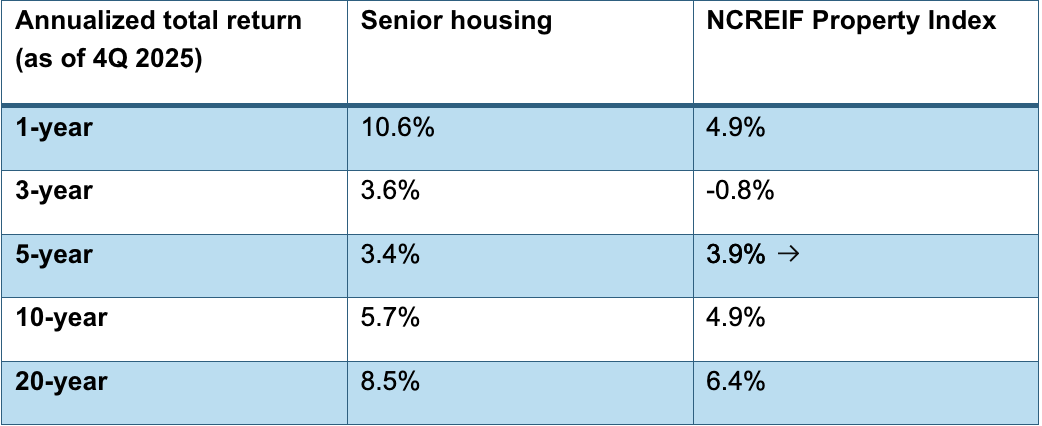
Source: NCREIF. Senior housing returns as reported in the NCREIF Property Index.
Institutional investors judge performance against peers, and the NCREIF Property Index is the benchmark most private real estate allocators use. For the year ending December 31, 2025, senior housing’s 10.6% return was the highest of any property type in the index. Retail, the next-closest property type, returned 6.8%. Senior housing outpaced it by nearly 400 basis points and more than doubled the index as a whole.
One strong year proves little on its own. Over longer periods, the comparison with the broader index still holds. Senior housing returned 3.6% annualized over three years while the NPI lost 0.8%. Over 10 years, the sector returned 5.7% against 4.9% for the index, and over 20 years it returned 8.5% against 6.4%.
The five-year window is the exception. Senior housing’s 3.4% trailed the NPI’s 3.9% over that span, a period that opened in early 2021 during one of the sector’s weakest operating stretches. For investors weighing senior housing ROI against other allocations, the full record matters more than any single year. It shows a sector that has outperformed the broader index across most measurement periods, not only the most recent one.
Where Did the 2025 Return Come From?
Both income and appreciation. Senior housing earned 5.6% on income against 4.8% for the NPI, and 4.8% on appreciation against 0.2% for the index.
How a return is earned matters as much as its size. A total return built on appreciation alone can reverse when valuations shift. One built on income depends on operating performance holding up. In 2025, senior housing delivered both.
Income carried its share of the result. The wider gap came from appreciation. Senior housing values appreciated 4.8% during the year while appreciation across the broader index was 0.2%. For investors tracking the relationship between interest rates and senior housing valuations, that divergence is worth attention. Across much of commercial real estate, higher rates held values flat. Senior housing values moved up.
Income has also held up over time. Senior housing income returns have exceeded the NPI’s in every measured period except the five-year window, including the 15- and 20-year horizons. That consistency separates operating-driven performance from a single year of valuation gains.
Capital Is Following the Returns
Returns show what investors have earned. Transaction activity shows what they are willing to commit next. In senior housing, that signal has strengthened for two consecutive years.
According to NIC MAP transaction data, closed senior housing deal volume reached $15.1 billion in 2025. That is more than double the $7.3 billion recorded in 2023 and the highest annual total in NIC MAP’s transaction series, which dates to 2008. The number of properties changing hands rose to 1,094, up from 771 two years earlier.
Asset values moved with volume. The average price per unit across senior housing transactions climbed to about $178,000 in 2025, up roughly 51% from $118,000 in 2023. Price per unit reflects the mix of assets that traded as well as valuations, so it is best read alongside volume. Read together, higher prices and more trades suggest buyers are competing for assets rather than sellers discounting to exit.
For investors considering entry, that depth of activity carries practical weight. A market with more trades produces more pricing evidence, more exit options and more senior housing benchmarks to underwrite against. For owners already in the sector, it offers a clearer read on how the market values the assets they hold.
Key Takeaways
- Senior housing led every NCREIF property type in 2025 with a 10.6% total return, more than double the 4.9% for the index as a whole.
- The sector outperformed the broader NCREIF Property Index over three, 10 and 20 years.
- Both income and appreciation contributed to the 2025 result, and senior housing income returns have beaten the index in every measured period except the five-year window.
- Transaction volume of $15.1 billion marked the highest annual total since NIC MAP’s series began in 2008.
- Rising price per unit alongside rising deal counts points to buyers competing for assets rather than sellers discounting to exit.
The Question Behind the Question
No data set can say whether senior housing is a good investment for a specific portfolio. That decision rests on strategy, capital structure, market selection, property assessment and operating partner. The figures above describe the sector as a whole, and they arrive alongside occupancy above 90% across Primary and Secondary Markets for the first time since 2007 and a supply gap NIC MAP sizes at more than $1 trillion through 2050.
The more productive question for investors, whether they are already in the sector or evaluating entry, is which markets and property types are producing these results. Answering it takes market-level data on occupancy, rates, inventory, construction and transactions.
Frequently Asked Questions
What was the NCREIF return for senior housing in 2025?
Senior housing returned 10.6% for the year ending December 31, 2025, according to NCREIF. That was the highest total return of any property type in the index, well above the Expanded NCREIF Property Index’s 4.9% and the next-closest property type, retail, at 6.8%. The return split into 5.6% from income and 4.8% from appreciation.
How does senior housing compare to other commercial real estate returns?
Senior housing outperformed the broader NCREIF Property Index over one, three, 10 and 20 years, returning 8.5% annualized over two decades against 6.4% for the index. It trailed over the five-year window, 3.4% against 3.9%, a period that opened in early 2021 during one of the sector’s weakest operating stretches.
How do interest rates affect senior housing values?
Higher borrowing costs repriced commercial property across every sector and held values flat across much of the market in 2025, with the NCREIF Property Index posting 0.2% appreciation. Senior housing values appreciated 4.8% over the same period. That divergence is why senior housing valuations are best read alongside occupancy and income trends rather than rate movements alone.
How much senior housing traded in 2025?
Closed transaction volume reached $15.1 billion across 1,094 properties in 2025, according to NIC MAP. That is the highest annual total in NIC MAP’s transaction series dating to 2008, and more than double the $7.3 billion recorded in 2023. Average price per unit rose to about $178,000, up roughly 51% from 2023.
What should investors evaluate before investing in senior housing?
Sector-level returns and transaction data show how senior housing has performed overall. Because the asset combines real estate with an operating business, the decision for a specific portfolio depends on strategy, cost of capital, hold period, market selection, property-level assessment and the operating partner. Market-level data on occupancy, rates, inventory, construction and transactions is what turns the sector case into a property case.