Where teams use new supply tracking
Monitor future competition and protect occupancy strategy.
Assess market saturation before breaking ground.
Evaluate supply-demand balance for acquisitions.
Assess market risk for financing decisions.
Celebrating 20 years of NIC MAP
Explore Two Decades of Data in a Competitive Market →


When teams ask “What’s in the pipeline?”, “What’s under construction in my market?”, or “Who’s developing in this area?”, they need forward-looking intelligence — not reactive market surprises.
NIC MAP provides early visibility into the development pipeline so teams can anticipate competitive activity before it affects occupancy, pricing, or investment performance.
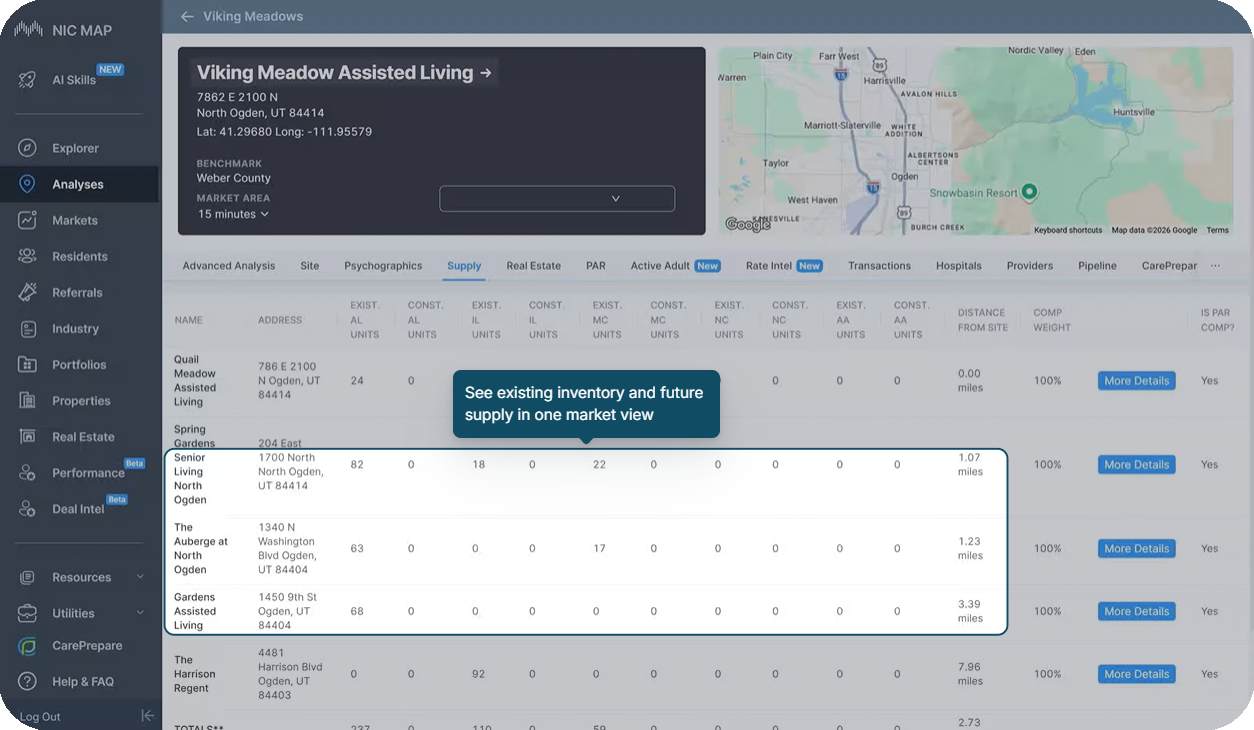
Tracking new supply is essential to understanding future market balance. New developments can materially impact occupancy, asking-rate dynamics, and absorption dynamics.
NIC MAP delivers nationwide pipeline intelligence so you can:
Senior housing markets are highly sensitive to supply shifts. Yet many teams lack consistent visibility into what’s coming next.
The result: proactive decision-making, better risk assessment, and more informed capital deployment.

Market Insight
Viewing projects in planning, under construction, or recently opened provides early visibility into future competitors, unit counts, care segments, and expected opening timelines.
Use it for:
Anticipating competitive activity, assessing market saturation, underwriting risk
NIC MAP Local
Detailed new construction and expansion project data in primary markets shows where competitive pressure is building at the submarket level.
Use it for:
Submarket-level supply monitoring, operator competitive planning
Pipeline Insight
Pipeline detail and reporting capabilities allow teams to compare projected supply across markets and assess longer-term competitive risk.
Use it for:
Investment committee reporting, portfolio risk analysis
Mapping Visualization
Mapping pipeline projects relative to existing properties clarifies which assets or submarkets will face new competitive pressure.
Use it for:
Site selection, competitive threat mapping, acquisition screening
Monitor future competition and protect occupancy strategy.
Assess market saturation before breaking ground.
Evaluate supply-demand balance for acquisitions.
Assess market risk for financing decisions.
Construction Pipeline shows projects in planning, under construction, and recently opened.
Yes. Construction Pipeline provides nationwide coverage, not limited to major metros.
Projects are captured once they enter formal planning or permitting stages.
Yes. NIC MAP tracks projects that are canceled or delayed to provide insight into market dynamics.
Data is sourced from industry-leading construction data partners that collect information directly from municipalities and developers.
Data is updated regularly as new information is received from NIC MAP’s data partners.