
Senior Housing Occupancy Crosses 90% for the First Time Since 2007

July 15, 2026
Updated: August 19, 2026
At the property level, 90% occupancy is a mark many operators have reached, held, and passed. At the industry level, across all 99 Primary and Secondary Markets in aggregate, it is a number the sector had not hit since late 2007. That changed in the second quarter of 2026, even as senior housing construction trends moved in the opposite direction.
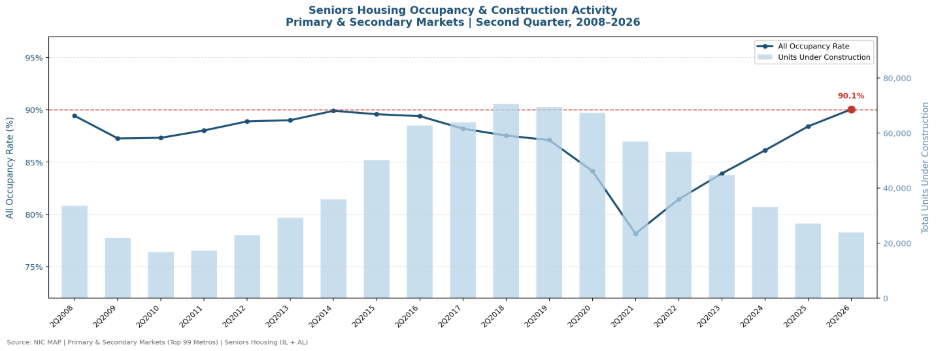
According to NIC MAP’s most recent data, senior housing occupancy across Primary and Secondary Markets, the top 99 metros nationally, reached 90.1%. That is the highest rate the sector has posted since late 2007, before the Great Financial Crisis upended capital markets and the development cycle that followed. NIC MAP began tracking Secondary Markets in 2008, so 90.1% is the highest occupancy rate ever recorded across the combined Primary and Secondary market universe.
That is not a small distinction.
Occupancy Reaches Its Highest Point Since 2007
Primary Markets, the top 31 metros NIC MAP has tracked since its founding, sit at 89.9%. The industry-wide 90.1% figure reflects the combined Primary and Secondary market average, and the depth of the milestone becomes clearer at the metro level. Fifty-seven of the 99 Markets are now individually above 90% occupied, and 23 have passed 92%, including Boston, Jacksonville, and San Francisco.
The gains are broad-based across property types. Majority Independent Living is operating at 91.5%, a threshold it crossed more than a year ago. Majority Assisted Living, at 88.6% as of the second quarter, has posted consistent gains each quarter and, at its current pace, is on track to exceed 90% by early to mid-2027. Each segment is moving in the same direction at its own pace, driven by demand absorption that has outpaced inventory growth for several years.
Source: NIC MAP ®| Primary and Secondary Markets (Top 99 Metros) | Senior Housing (IL + AL)
Senior Housing Construction Trends Move in the Opposite Direction
The occupancy picture would look different if supply were keeping pace. It is not. Across Primary and Secondary Markets, senior housing units under construction have fallen below 24,000, the lowest level since mid-2012. Construction starts continue to hover at historically low levels with no visible sign of acceleration.
The 2012 comparison is instructive. That cycle bottom took four full years to return to its prior peak, which it reached around 2016, held for several years, then began the long deceleration that continues today. Add the typical two-year lag from groundbreaking to opening, and substantial inventory growth from any new cycle is unlikely to reach the market before 2030 at the earliest.
That is not an argument against investment. It is a reason to take senior housing investment seriously right now, while the occupancy advantage belongs to existing and well-positioned operators.
Sustained Occupancy Shifts the Advantage to Existing Operators
The 90% threshold carries meaning beyond the headline number. Across multiple cycles, sustained high occupancy reflects strong supply-demand fundamentals, the kind of market context lenders weigh when underwriting new deals and investors weigh when evaluating existing portfolios. The current data fits that pattern. Demand absorption has outpaced inventory growth, and the supply-demand gap looks set to persist through at least the end of the decade.
The more consequential question is not whether demand holds. The demographic case for sustained use of senior housing is well-established and building, as the leading edge of the baby boom moves deeper into the age cohort that drives sector demand. The question is when the next supply cycle develops: how quickly it starts, how aggressively it scales, and whether capital markets conditions support the kind of ramp the 2013 to 2018 cycle produced.
The 2012 cycle bottom offers both a precedent and a caution. Occupancy climbed first. Supply followed later. The lag between the two created significant opportunity for those already positioned. The current setup looks much the same, with a demand tailwind ahead that appears larger and longer than anything the sector has seen before.
Frequently Asked Questions
Are senior housing construction starts increasing in 2026?
No. As of the second quarter of 2026, construction starts remain at historically low levels with no sign of acceleration. Units under construction across Primary and Secondary Markets have fallen below 24,000, the lowest level since mid-2012.
When will new senior housing supply reach the market?
With a typical two-year lag from groundbreaking to opening and no current acceleration in starts, substantial new inventory is unlikely to reach the market before 2030 at the earliest.
What is senior housing occupancy in 2026?
In the second quarter of 2026, occupancy across the top 99 Primary and Secondary Markets reached 90.1%, the highest rate since late 2007 and the highest ever recorded across the combined Primary and Secondary Market universe.