See how rates and occupancy are trending in your markets
Foundational data to help make the right decisions
Rate and occupancy trends are foundational to every senior housing decision — from underwriting to portfolio strategy to market planning.
The data that answers your top questions
When teams ask “What are rates in the market?”, “How is occupancy moving?”, or “How have rates and occupancy trended over time?”, they need consistent, granular market data — not one-off surveys or anecdotal broker insight.
NIC MAP provides the consistent, granular market intelligence teams need to act with confidence.
The full rate and occupancy picture in one place
Understanding senior housing market performance takes more than a single data point. Teams need to see average rates, rate ranges by unit type, occupancy levels, and how rates and occupancy are trending over time.
NIC MAP delivers aggregated and property-level rate and occupancy intelligence in one platform so you can:
See how market rates are trending
Monitor occupancy performance
Track rate trends over time
Compare your property to market averages
Turn rate and occupancy data into actionable market insight
Senior housing revenue and performance are directly tied to local market rate growth and the balance of supply and demand — yet many teams lack consistent visibility into what’s actually happening in their markets.
NIC MAP solves the core challenges decision-makers face.
Limited visibility into local rate dynamics
See average rates and rate ranges by care level and unit type.
Unclear occupancy performance
Understand occupancy by care segment, unit type, and submarket.
Difficulty tracking trends over time
View quarter-over-quarter and year-over-year rate and occupancy changes.
No clear view of local rate, care-fee, and concession pattern
See how rates, care fees, and concessions are trending across the local market.
Inability to benchmark assets or markets
Compare properties, PMAs, metros, and national performance.
The result: sharper underwriting assumptions, clearer market positioning, and stronger capital-allocation decisions.
How NIC MAP supports rate and occupancy analysis
See how rates and occupancy are performing in your market
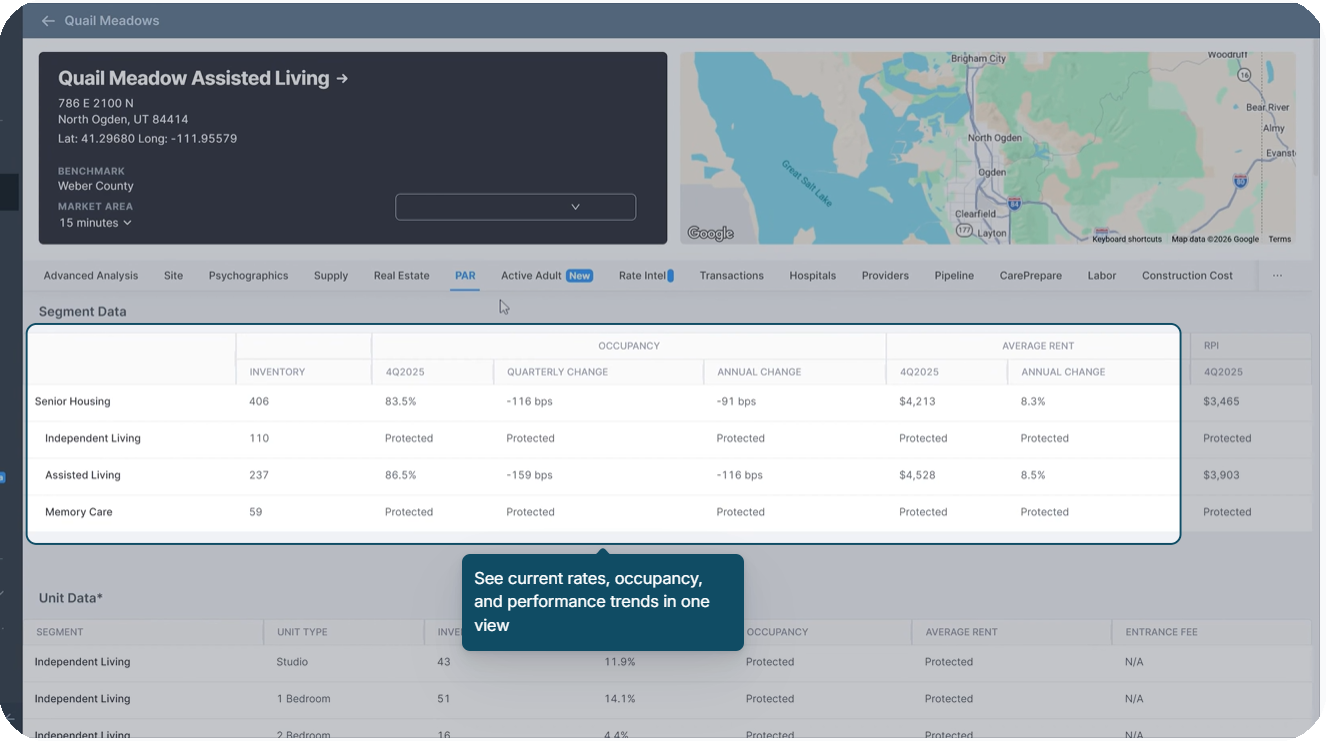
Property Advisor Report (PAR)
PAR brings together rate and occupancy data by care segment and unit type, giving you a clear baseline view of how the market is performing — the kind of view that used to take weeks of building-by-building research
Use it for:
Underwriting validation, portfolio monitoring, market analysis
Go deeper on rates, care fees, and concessions at the property level
Rate Intelligence
Rate Intelligence adds property-level rate, care-fee, and concession context across the local market. It draws on structured secret-shop outreach — the same kind of information any prospective resident, family member, or lender would gather by calling buildings — brought together in one place.
Use it for:
Underwriting, sales strategy, market analysis
Track how rates and occupancy are changing over time
Trends Module
Quarter-over-quarter and year-over-year trend data show whether a market is strengthening, softening, or stabilizing — informing forward-looking investment and market-planning decisions.
Use it for:
Monitoring market cycles, long-term planning, investment strategy
Benchmark local performance against broader markets
Market Comparison Tools
Comparing PMA, metro, and national pricing and occupancy data clarifies whether a local market is outperforming or underperforming broader benchmarks.
Use it for:
Portfolio strategy, expansion planning, risk assessment
What are average rates by care segment in my market?
PAR shows aggregated rate and occupancy data by care level and unit type at the submarket and PMA level
Can I see occupancy for my specific PMA?
Yes. Occupancy performance can be viewed by PMA, submarket, metro, or custom geography.
Do you track pricing trends over time?
Yes. Quarterly trend data shows historical rate and occupancy performance with change metrics.
Can I see how rates and concessions vary by unit type for nearby properties?
Yes. Rate Intelligence covers property-level rate, care-fee, and concession data for around 6,000 properties — collected through structured secret-shop outreach, the same kind of information any prospective resident, family member, or lender would gather by calling individual buildings.
How current is the data?
Rate and occupancy data is refreshed every quarter, typically about 90 days after quarter end.