







Celebrating 20 years of NIC MAP

Explore Two Decades of Data in a Competitive Market →

Fast access to rich sources of information for senior living development projects

What does NIC MAP do for senior housing developers?

NIC MAP helps senior housing developers identify where to build, validate market feasibility, and track competing projects — all from a single platform with data on 12,000+ active construction projects and 35,000+ existing properties nationwide. Developers use NIC MAP to assess local demand, understand current supply absorption, pinpoint underserved markets, and monitor the construction pipeline for future competitive pressure before breaking ground. With more than 20 years of historical market data and demographic demand indicators built in, NIC MAP gives development teams the evidence base to move projects through approval and financing faster.

Pine Park HealthFOXAgape Hospice CarePowerback RehabilitationEmpowerMe WellnessNational Health InvestorsWells Fargo

Solving top challenges senior housing developers face today

Problem:
Identifying the best locations for new senior housing developments is crucial but complex, involving various factors such as demographics, competition, and accessibility.

Solution:
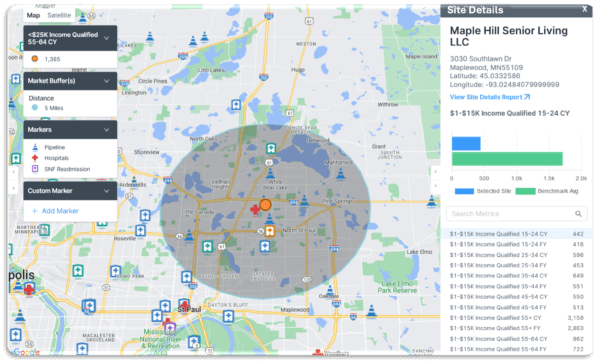
Access location-based analysis, demographic insights, and competitive assessments to help identify optimal development locations. Look at potential demand in different areas, ensuring that new developments are well-placed to attract residents.
Schedule a consultation

Problem:
Accurately forecasting market demand for senior housing in specific regions is challenging and requires immense amounts of data.

Solution:
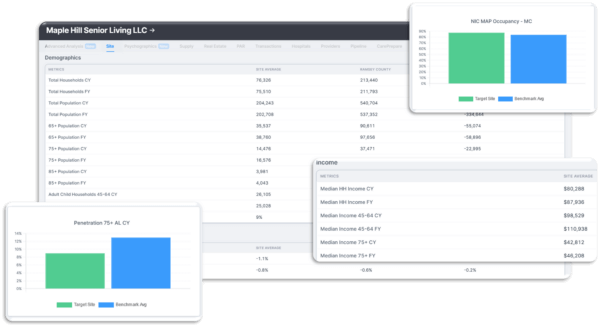
Evaluate changes in population, income, and supply to project future requirements for senior housing. This allows developers to tailor projects to meet predicted market demands, minimizing the risk of overbuilding or underbuilding.

Schedule a consultation

Problem:
Assessing the financial feasibility of new developments requires detailed financial analysis and projections

Solution:
Financial analytics can provide detailed cost estimates, revenue projections, and return on investment (ROI) analyses. This helps developers create robust financial plans, secure funding, and ensure the profitability of their projects.

Schedule a consultation

Problem:
Understanding the competitive landscape and positioning new developments effectively is crucial.

Solution:
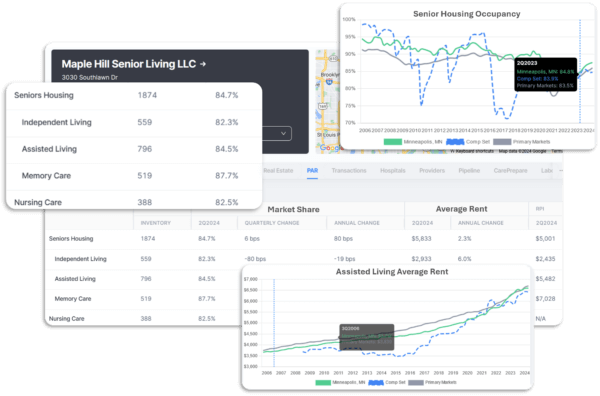
Competitive analytics can provide insights into existing and upcoming senior housing projects, their pricing, occupancy rates, and amenities. This helps developers identify market gaps, differentiate their offerings, and position their projects competitively.

Schedule a consultation

Problem:
Developing effective marketing and sales strategies to attract residents can be challenging in a competitive market.

Solution:
Identify the most effective channels, messages, and strategies for reaching potential residents. Insights into customer preferences, income levels and market trends can optimize marketing efforts and improve sales performance.

Schedule a consultation

Ensure your firm’s projects are properly planned for the greatest return on investment possible.

The world’s leading senior housing data and analytics platform

  • Map Resident Draw Area
  • Explore Markets in Detail
  • Select Optimal Markets
  • Track Key Economic Indicators
  • Identify Optimal Development Sites
  • Evaluate Management Company Performance
  • Map Future Supply
  • Explore Transaction History
  • Visualize Resident Wealth
  • Track Construction Costs
  • Evaluate Labor Market Conditions
  • Monitor Market Conditions
  • Map Resident Draw Area
  • Explore Markets in Detail
  • Select Optimal Markets
  • Track Key Economic Indicators
  • Identify Optimal Development Sites
  • Evaluate Management Company Performance
  • Map Future Supply
  • Explore Transaction History
  • Visualize Resident Wealth
  • Track Construction Costs
  • Evaluate Labor Market Conditions
  • Monitor Market Conditions
  • Map Resident Draw Area
  • Explore Markets in Detail
  • Select Optimal Markets
  • Track Key Economic Indicators
  • Identify Optimal Development Sites
  • Evaluate Management Company Performance
  • Map Future Supply
  • Explore Transaction History
  • Visualize Resident Wealth
  • Track Construction Costs
  • Evaluate Labor Market Conditions
  • Monitor Market Conditions

Discover the $275 billion investment shortage in senior housing supply emerging by 2030

A multidecade explosion of senior housing demand is rapidly unfolding as the population aged 80 and older continues to grow significantly faster than the senior housing supply base. This report rovides comprehensive insight into these conflicting market dynamics and highlights investment opportunities in the senior housing sector.

The prospect of having only one data provider that aggregated and expanded our analytics program was very appealing, and NIC MAP delivered. Once we got the tool fine-tuned to our process, the time it took to screen a site was cut by 90 percent.

Allegro Development Company

Schedule a consultation

Fill out the form to learn more about how our platform can help support your healthcare business and save you time in an increasingly competitive market.

FAQs

How does NIC MAP help senior housing developers choose where to build?

NIC MAP helps developers identify where to build by combining location-based demand analysis, demographic insights, and market and supply assessments across 35,000+ existing properties and 12,000+ active construction projects. Developers can find underserved markets and validate feasibility before breaking ground. See the Supply Pipeline solution.

Can NIC MAP show me what senior housing projects are already planned nearby?

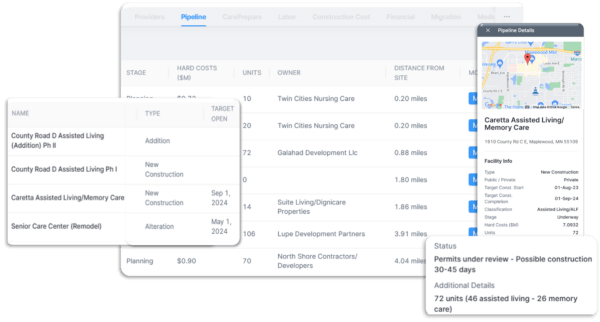
NIC MAP tracks 12,000+ active construction projects nationwide, so developers can see which senior housing projects are already underway in a market before committing capital. This future-supply visibility helps avoid overbuilding. Explore Market Comparison to weigh sites against each other.

How does NIC MAP support feasibility studies and financing approval?

NIC MAP provides the demographic demand indicators, absorption data, and 20+ years of market history that development teams use to build the evidence base for feasibility studies, approvals, and financing. One firm, Allegro Development Company, reported cutting site-screening time by 90% after adopting NIC MAP.

Can NIC MAP forecast senior housing demand for a specific region?

NIC MAP helps developers by evaluating changes in population, income, and existing supply to assist their decisions in forecasting senior housing requirements in a given region.

What data does NIC MAP give developers on demographics and resident wealth?

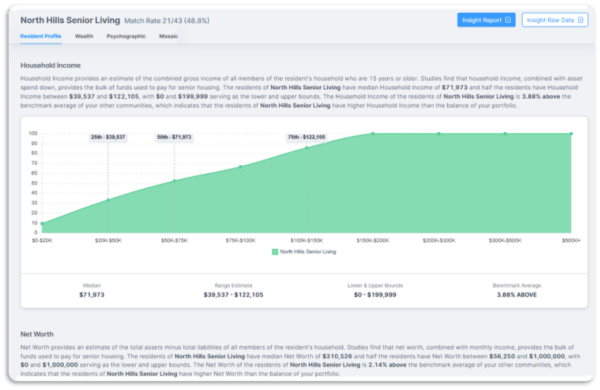
NIC MAP includes demographic demand indicators and resident-wealth profiling, letting developers map the draw area around a site and visualize the income and wealth of the senior population it would serve. This informs both site selection and product positioning.

How much can NIC MAP speed up site screening?

Site screening that traditionally takes weeks can be dramatically compressed; Allegro Development Company reported a 90% reduction in the time required to screen a site after fine-tuning NIC MAP to their process. Schedule a consultation to see it applied to your pipeline.

Is NIC MAP useful for developers who also acquire or reposition existing properties?

Beyond ground-up development, NIC MAP supports acquisition and repositioning decisions with occupancy, rate, and transaction data. Developers who also invest may find the Investors page relevant, and those who build to operate can review the Operators page.