
Why the Senior Care Industry Is Attracting New Investors: NIC MAP’s Data From CREDA 2026
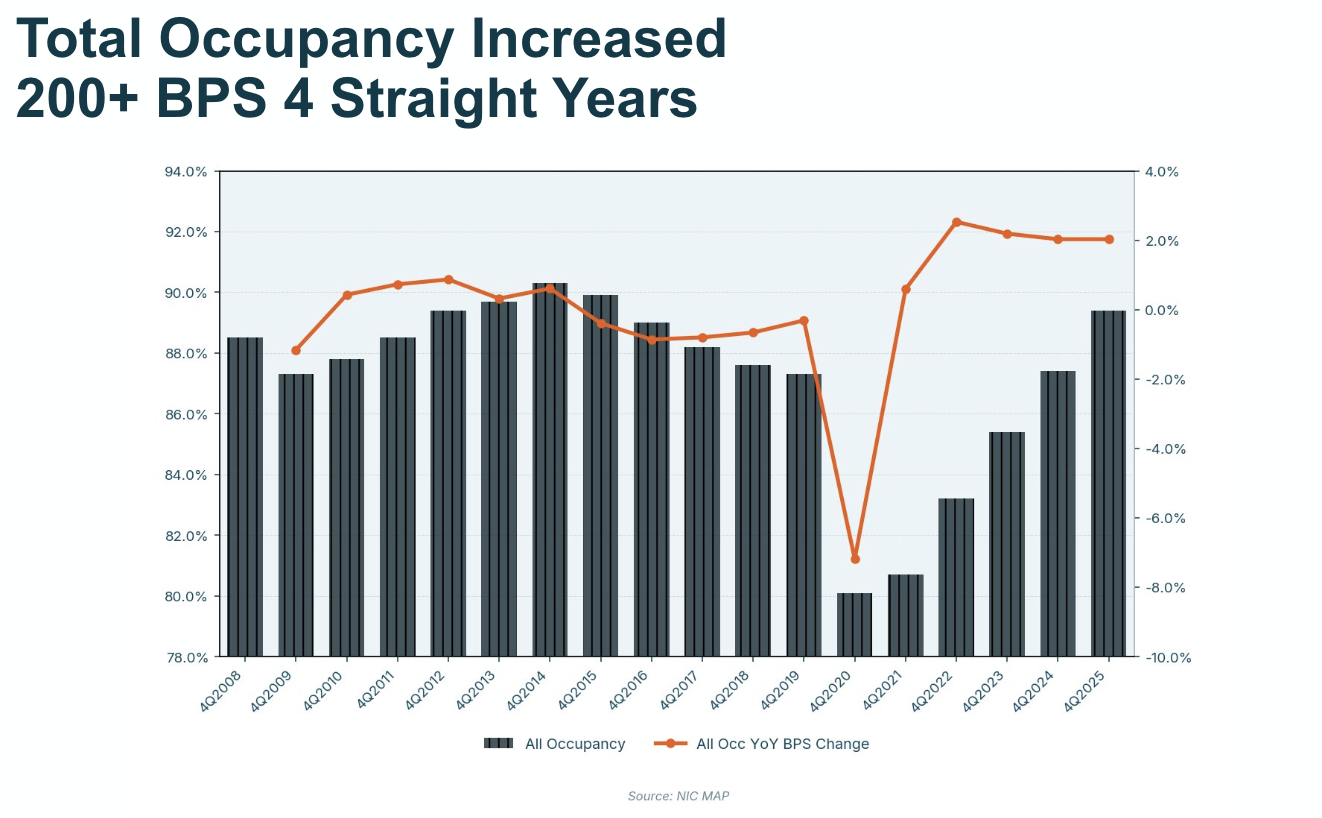
The senior care industry is attracting new investors for three reasons that NIC MAP put on one stage at the 2026 CREDA Conference in October: demographic demand that is already converting to move-ins, construction starts near historic lows, and total occupancy gains of more than 200 basis points in each of the last four years.
NIC MAP CEO Arick Morton presented the data behind each point during a panel on senior housing as the next opportunity within multifamily, moderated by Lisa McCracken, Head of Research and Analytics at NIC, with Julie Ferguson, President of the Southern Division at Ryan Companies US. The audience was largely commercial real estate and multifamily developers and investors, many of them new to senior housing. Here’s a recap of the session and what the panel told that audience about senior housing investment.
The 80+ Population Is Growing on a Fixed Schedule
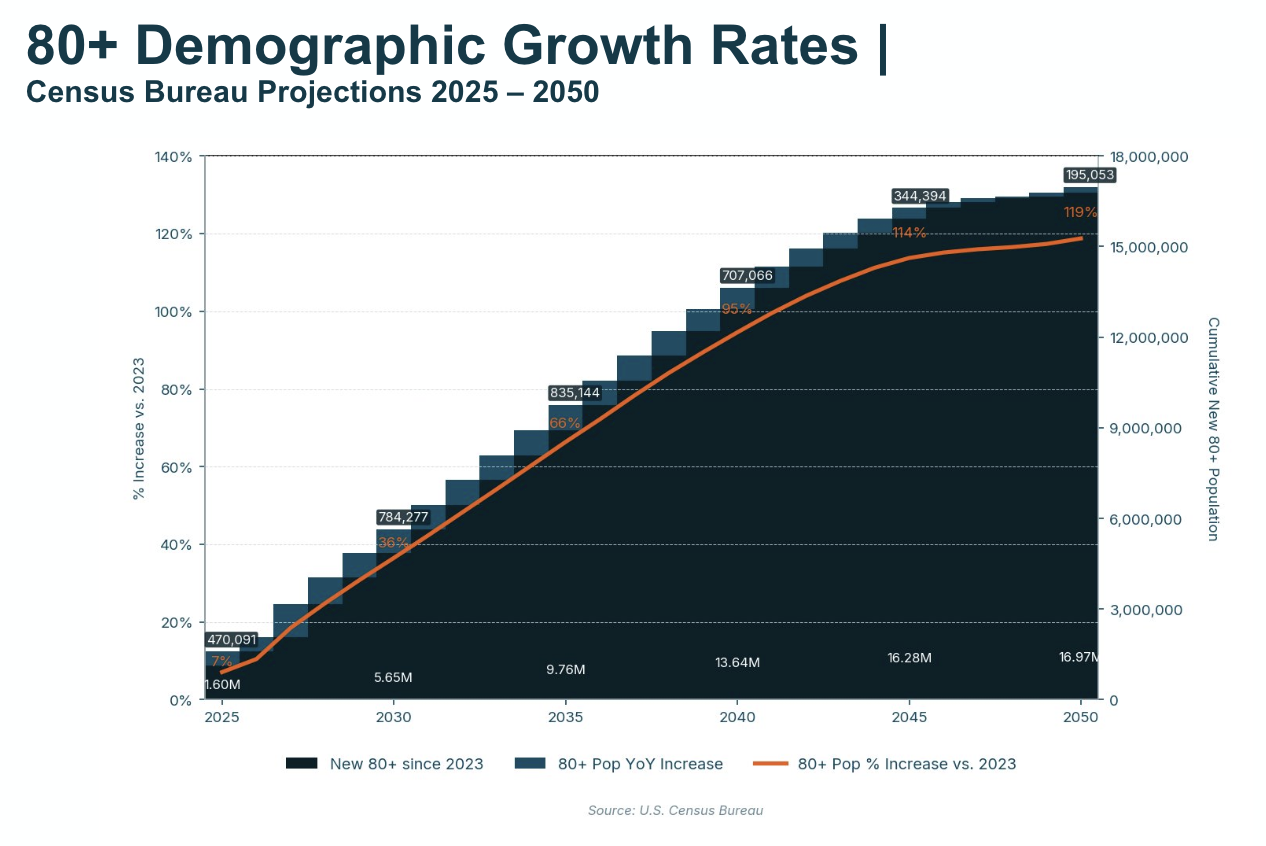
Morton opened with Census Bureau projections for the 80+ population. The average senior housing resident moves in at about age 80, which makes this cohort the sector’s primary demand driver. Relative to a 2023 base, the 80+ population is projected to grow 36% by 2030, 66% by 2035, 95% by 2040, 114% by 2045 and 119% by 2050. In raw terms, that is roughly 5.65 million additional people aged 80 and older by 2030, 9.76 million by 2035, 13.64 million by 2040 and 16.97 million by 2050.
Unlike most demand drivers in real estate, this one does not depend on assumptions about behavior or the economy. The people who will turn 80 over the next five years are a known group with growth curve is setcurves set by census counts rather than by the rate cycle. It is the starting point for every chart that followed.
Absorption Is Running Well Above the Pre-2020 Pace
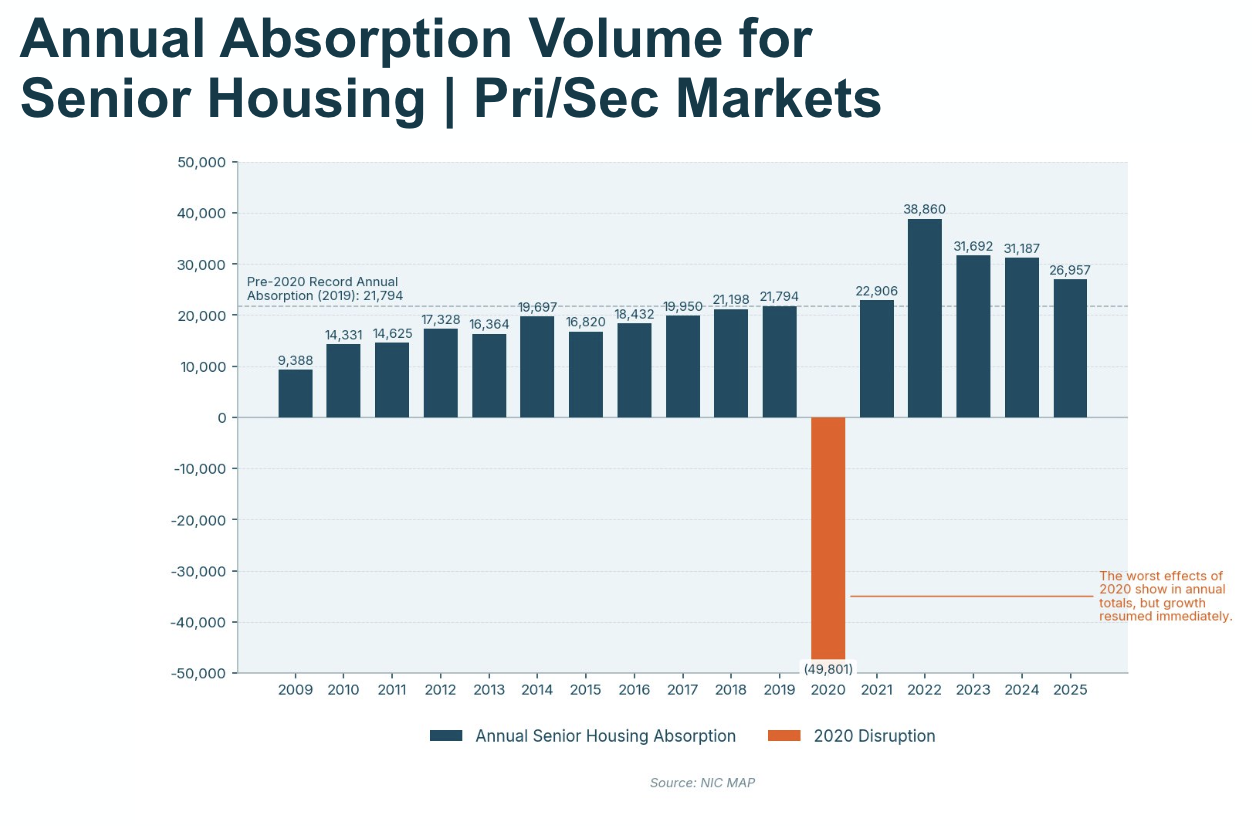
Before 2020, the strongest year on record for senior housing absorption across Primary and Secondary Markets was 2019, at 21,794 units, according to NIC MAP. Then came 2020, a one-year disruption with negative absorption of 49,801 units.
The years since are the part Morton emphasized. Absorption was 22,906 units in 2021, 38,860 in 2022, 31,692 in 2023, 31,187 in 2024 and 26,957 in 2025. Every year from 2022 through 2025 exceeded the 2019 record. Over the longer run, annual absorption averaged roughly 17,000 units from 2009 through 2019. From 2022 through 2025 the average was roughly 32,000 units a year, about 1.5 to 2 times the pre-2020 pace.
Construction Starts Remain Near Historic Lows
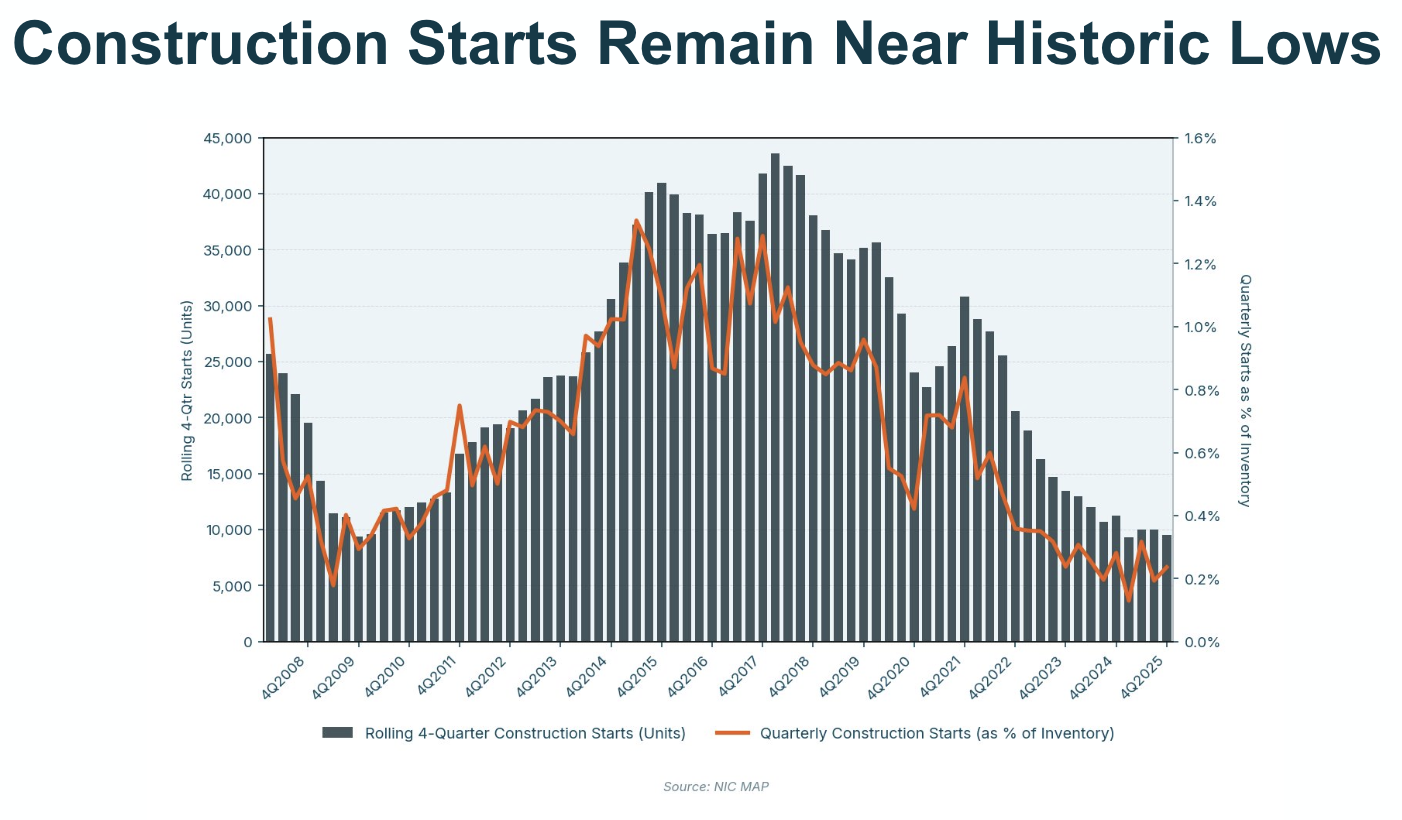
Demand has strengthened. Supply has moved the other way. Rolling four-quarter senior housing construction starts peaked above 43,000 units in late 2017. By the fourth quarter of 2025 the same rolling figure was below 10,000 units, among the lowest readings in a series that goes back to 2008.
The chart showed starts as a share of inventory as well as a unit count. Quarterly starts ran above 1.2% of existing inventory at the 2015 to 2017 peak. In 2025 the figure sat around 0.2% to 0.3%. NIC MAP tracks construction starts and units under construction by market, and for the developers in the room the message was that the pipeline has been thin for years, not months.
Starts Versus Absorption: The Gap That Sets Up the Next Decade
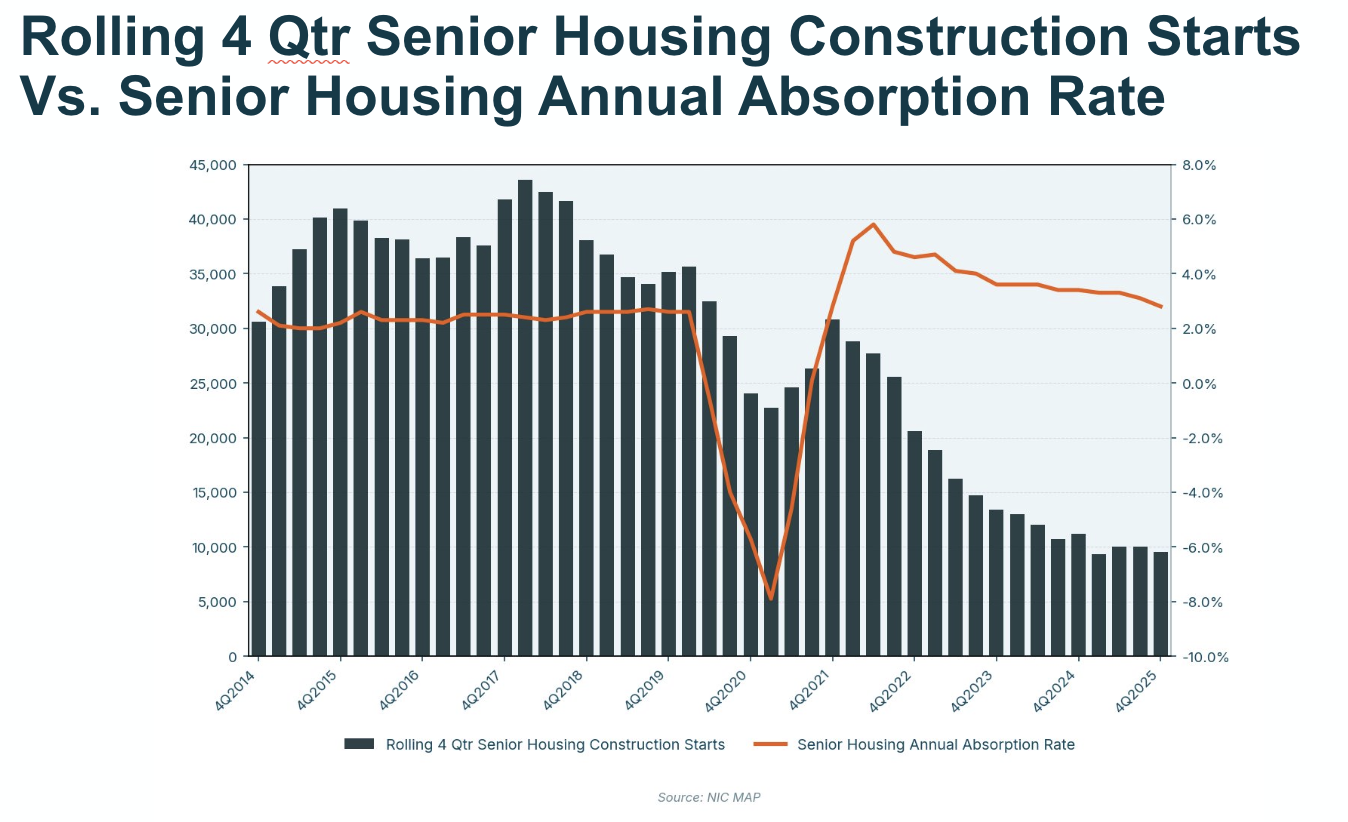
Morton then called out two specific things. From 2014 through 2019, annual starts of 30,000 to 43,000 units were paired with an annual absorption rate of roughly 2% to 2.5% of inventory. Supply and demand moved at a comparable pace.
Since 2022 the relationship has inverted. The annual absorption rate has run roughly 3% to 6% of inventory while rolling four-quarter starts have fallen below 10,000 units. Starts are running at a fraction of the pace that prevailed when absorption was lower. Supporting data in the presentation puts a scale on that gap: senior housing inventory grew about 0.5% a year as of the fourth quarter of 2025, while the 80+ population is projected to grow 3% to 7% a year through 2030. NIC MAP estimates the market needs roughly 100,000 new senior housing units a year in most years through 2035 to hold national senior housing occupancy at 90% as the population ages.
Occupancy Has Gained 200+ Basis Points Four Straight Years
The last thing he covered tracked what that imbalance has done to occupancy. Total senior housing occupancy fell to roughly 80% in 2020. It has since gained more than 200 basis points year over year in each of 2022, 2023, 2024 and 2025.
The gains have continued into 2026. As of the third quarter, occupancy across NIC MAP’s 31 Primary Markets stands at 90.4%, up from 89.8% in the second quarter and the first reading above 90% for those markets since 2014, according to NIC’s October 1 release of NIC MAP data. Across the broader set of 99 Primary and Secondary Markets, occupancy had already crossed 90% in the second quarter for the first time since late 2007. The 90.4% figure is the one Morton cited on stage.
Why New Capital Is Entering, and What the Panel Told Multifamily Developers
The data explains the interest. The panel discussion covered what multifamily developers and investors need to understand before acting on it. Morton reminded the audience that senior housing is a submarket business, with most communities competing within roughly a 15 to 25 minute drive time, as reported by CREDA.
McCracken noted that the capital base has broadened beyond the lenders and REITs that have long been active in the sector. Private equity, family offices, sovereign wealth funds, pension funds and life insurance companies are now participating, and senior housing regularly shares the top spot with data centers in industry investor confidence surveys. Performance data has helped make the case. Senior housing was broken out as its own property type in the NCREIF Property Index in 2024, and it returned 10.6% in 2025, the highest of any property type in the index.
Ferguson pointed to the differences that catch new entrants off guard. Multifamily typically runs 80% to 85% rentable square footage, while senior living runs 55% to 65% because of the amenity and common space residents use. In multifamily, management can often come later. In senior housing, equity partners want to know the operator before they commit. Those distinctions matter for a senior care industry attracting new investors from adjacent property types: the sector-level case is in the data, and the deal-level case depends on the submarket and the operator.
Key Takeaways
- The 80+ population is projected to grow 36% by 2030 and 119% by 2050 against a 2023 base, and that growth is set by people already alive today rather than by economic conditions.
- Annual absorption from 2022 through 2025 averaged roughly 32,000 units, and every one of those years exceeded the pre-2020 record of 21,794 units set in 2019.
- Rolling four-quarter construction starts fell below 10,000 units by the fourth quarter of 2025, down from a peak above 43,000 units in late 2017.
- Total occupancy has gained more than 200 basis points in each of the last four years, and Primary Markets occupancy reached 90.4% in the third quarter of 2026, the first reading above 90% for those markets since 2014.
- Multifamily experience does not transfer directly to senior housing, which the panel described as a submarket business with a lower rentable square footage ratio and an operator decision that comes before capital commits.
Taken together, the five charts describe a market where demand is set by demographics already in motion, supply has not kept pace, and occupancy gains have held for four consecutive years rather than a single one. That combination, more than any one data point, is what put senior housing on a multifamily stage at CREDA.