NIC MAP Releases Top Markets for Senior Housing Transactions of 2025
Published Date: December 11, 2025
New data highlights an increase in transactions and price-per-unit, indicating a strong total transaction volume
Raleigh, N.C., (December 11, 2025) — NIC MAP, the leading provider of data for the senior housing industry, released its list of the Top Markets for Senior Housing Transactions of 2025, revealing an industry that continues to gain strength and attract capital across every region of the United States.
According to NIC MAP data, which includes 19 years of industry leading market data, the U.S. is facing a 550,000-unit shortfall in senior housing by 2030, representing a $275 billion investment shortage and requiring the industry to more than triple its current development pace to meet surging demand from the 80+ population.
Transaction activity signals intensifying market needs
According to NIC MAP data, the total closed transaction volume in seniors housing and nursing care for the first three quarters of 2025 reached $16.3 billion, with more than $10.3 billion in senior housing acquisitions. This is evidence of the senior housing sector’s continued resilience and investor confidence.
As of the third quarter, the rolling four-quarter average price per senior housing unit rose to $175,000, marking six consecutive quarters of gains and a 43% year-over-year increase in price. More than 1,000 senior housing properties traded hands in the past 12 months, up 7% from the prior year.
“Transaction activity, valuations, and capital interest in senior housing all accelerated across 2025, with the sector continuing its recovery and drawing renewed investor attention to long-term opportunities.”
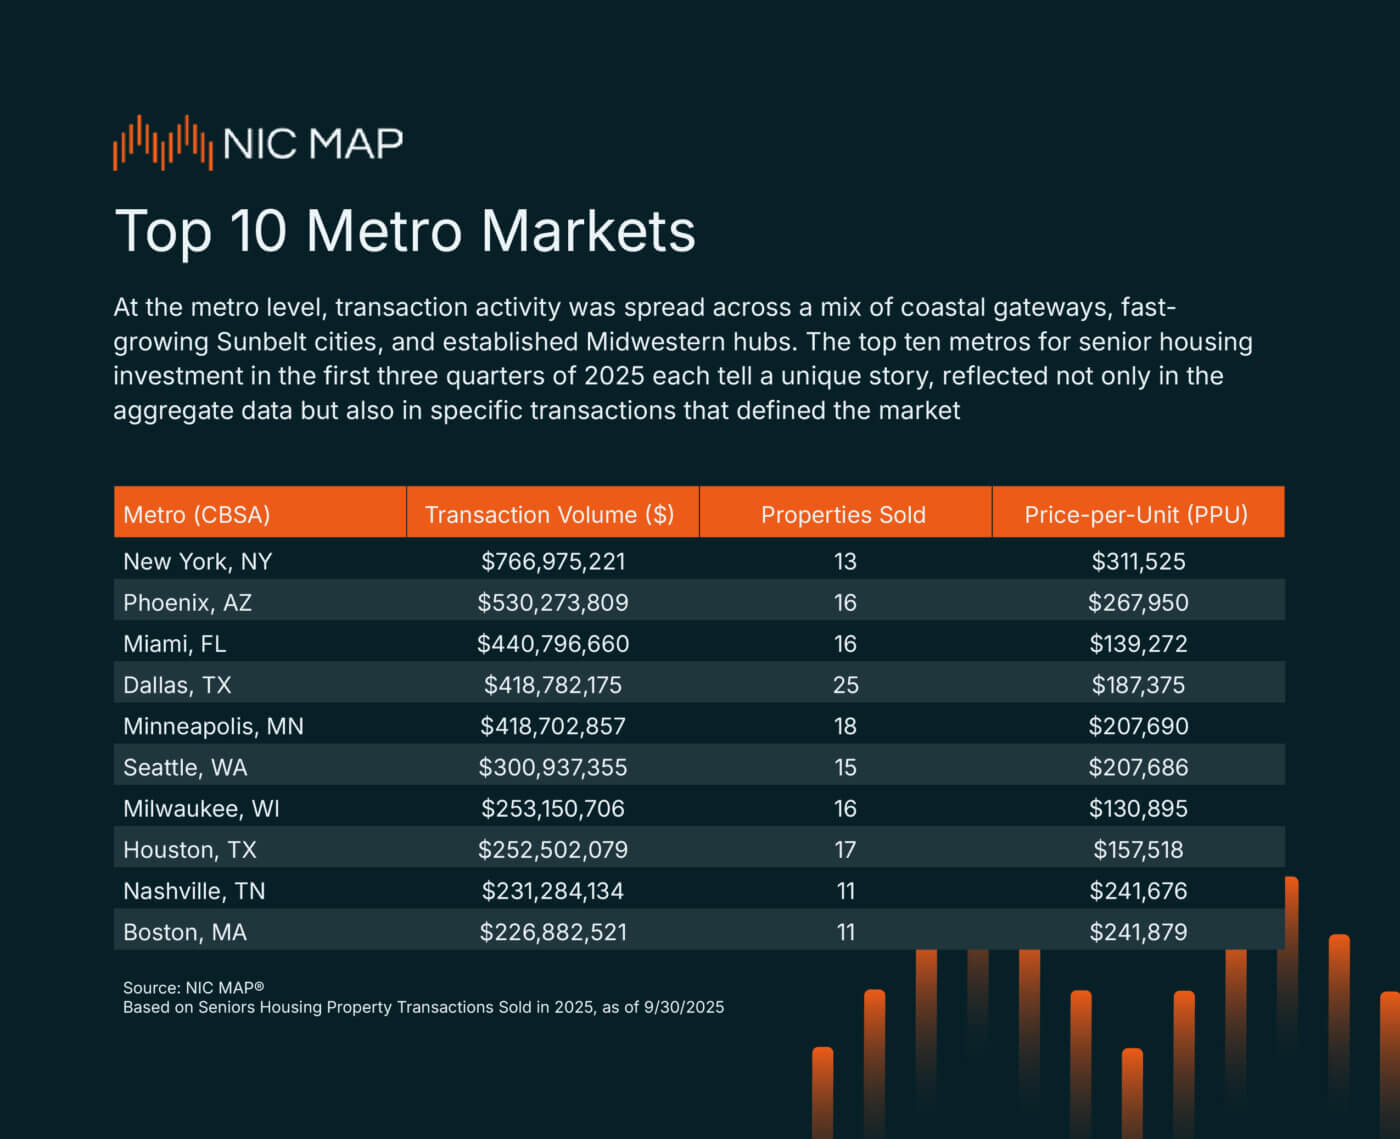
Top 10 Metro Markets
According to NIC MAP data, these are the top ten metros for senior housing investment in the first three quarters of 2025:
- New York: $766 million transaction volume; 13 properties sold at a price-per-unit of $311,525
- Phoenix: $530 million transaction volume; 16 properties sold at a price-per-unit of $267,950
- Miami: $440 million transaction volume, 16 properties sold at a price-per-unit of $139,272
- Dallas: $418 million transaction volume, 25 properties sold at a price-per-unit of $187,375
- Minneapolis: $418 million transaction volume, 18 properties sold at a price-per-unit of $207,690
- Seattle: $300 million transaction volume, 15 properties sold at a price-per-unit of $207,686
- Milwaukee: $253 million transaction volume, 16 properties sold at a price-per-unit of $130,895
- Houston, $252 million transaction volume, 17 properties sold at a price-per-unit of $157,518
- Nashville: $231 million transaction volume, 11 properties sold at a price-per-unit of $241,676
- Boston: $226 million transaction volume, 11 properties sold at a price-per-unit of $241,879
“Investor activity is broad-based and strategically focused,” Morton added. “We’re seeing capital flow into both primary and secondary markets, from New York to Phoenix to Nashville, as investors pursue assets that align with shifting demographics and operational performance.”
A national shortage and generational opportunity
With sustained transaction activity, rising valuations, and expanding buyer diversity, including REITs, private equity firms, and regional operators, the senior housing sector is positioned for continued strength entering 2026.
“Investor behavior today reflects conviction in the sector’s fundamentals,” said Morton. “As demographic demand accelerates and operating metrics improve, senior housing remains a compelling opportunity in the broader commercial real estate landscape. The transaction data tells us where investors are preparing from growth. Now we need development to follow because we simply don’t have enough senior housing in the pipeline.”
Access the Top Senior Housing Transactions of 2025 for a detailed breakdown of the year’s most significant deals, including transaction volume, price-per-unit analysis and regional market insights.
About NIC MAP
NIC MAP is the senior housing industry’s independent market-data service, operating within the National Investment Center for Seniors Housing & Care, a 501(c)(3) nonprofit research organization. Our platform brings together what the industry used to gather property-by-property — occupancy, rate trends, inventory, absorption, construction activity, and transactions across 35,000+ U.S. properties — informing the underwriting, capital allocation, and portfolio decisions of operators, lenders, capital providers, developers, REITs, federal agencies, academic researchers, and state and local governments. For more information, visit www.nicmap.com.
Media Contact:
Mary Prevost, Prevost Partners
612.202.3047, mary@prevostpartners.com