Senior Living Market Trends: A Market Closer to Full Than It Appears

April 28, 2026
Updated: May 28, 2026
Senior housing occupancy trends suggest the sector is nearing full capacity. See how median occupancy reveals a tighter market than it appears.
A Different Way to Read Senior Housing Occupancy
For years, senior housing occupancy has been the industry’s go-to barometer for understanding the broader senior living market. It’s simple, familiar, and widely referenced. But like most metrics, it doesn’t always tell the full story. At a glance, national occupancy still suggests there’s room left to run. But when you look a little closer—especially through the lens of median occupancy—the picture starts to shift. The typical property isn’t sitting at excess capacity. In many cases, it’s already operating close to where it naturally tops out.
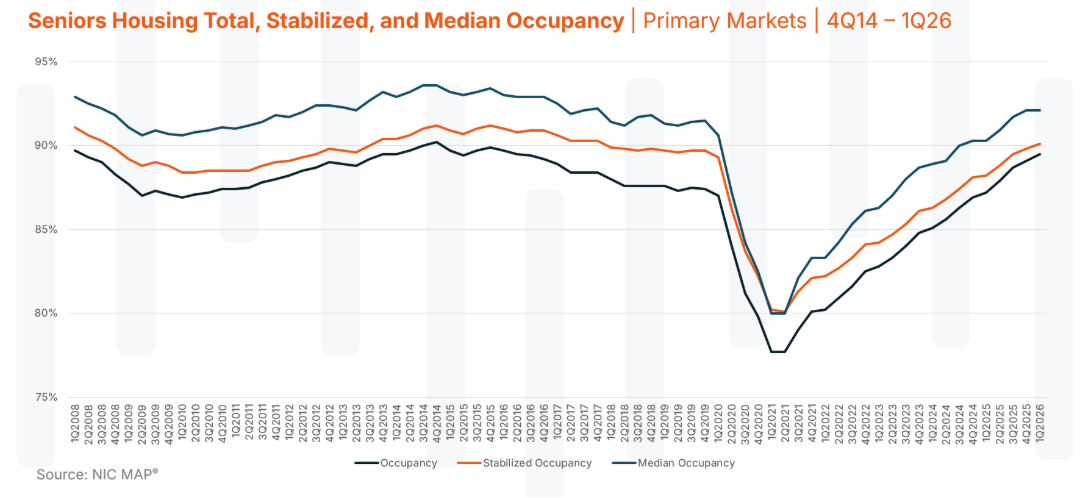
NIC MAP’s 1Q26 data brings that into focus. Median occupancy in primary markets has moved just above 92%, with stabilized occupancy slightly over 90%. That may not sound dramatic on its own, but it starts to mean something different when you consider how senior housing actually operates day-to-day. This is where interpretation matters. The industry may be closer to full capacity than it realizes—an important signal in today’s operating environment.
Median Occupancy Deserves More Attention
Most conversations still revolve around total or stabilized occupancy. Both are useful, but they’re measured at the unit level, which means they blend everything together—new lease-ups, older properties, high performers, and those still working through challenges. Median occupancy cuts through that noise. Instead, it looks at the typical property, not the weighted average of every unit. And right now, that typical property is running at about 92% occupancy.
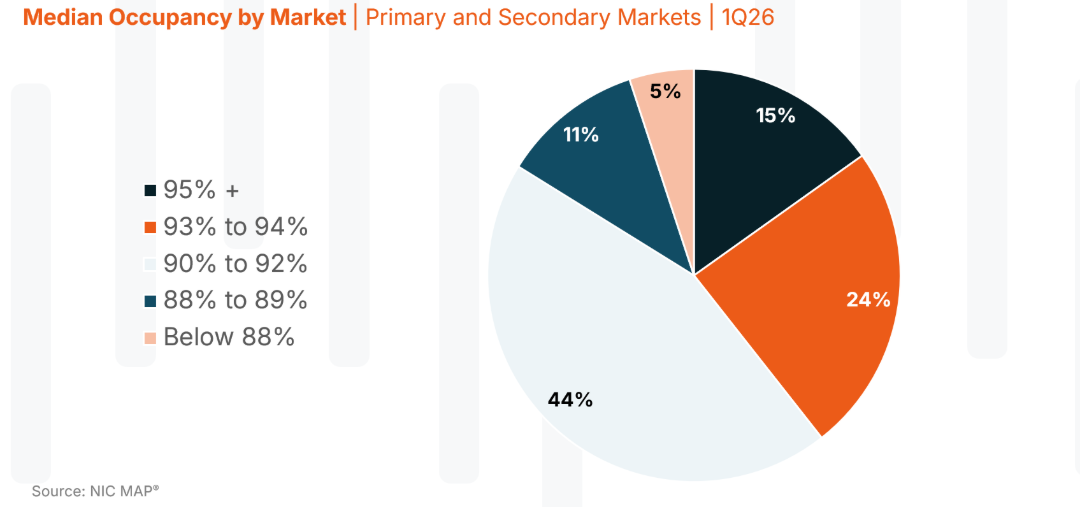
That number approaches the range where most operators would say a building is effectively “full.” Not 100%, but full in a practical sense. The kind of full that reflects normal turnover, move-ins, and the realities of operating a senior housing community. The market-level view reinforces the point. Roughly two out of every five primary and secondary markets are already seeing median occupancy above 93%. That’s not a niche trend; it’s a meaningful share of the country and a key indicator shaping market trends in senior living. So, while averages may still suggest room, the center of the market is telling a different story.
Capacity on Paper vs. Capacity in the Real World
This is where the distinction becomes more than academic. Yes, there are still vacant units. That’s clear in total occupancy figures. But not all vacancies behave the same way, and not all of them represent capacity you can realistically fill. Some of those units sit in communities still stabilizing. More commonly, some are tied to older product that doesn’t quite match today’s expectations or carry operational friction—staffing, pricing, or product—that slows absorption.
All of that shows up in the data. But it doesn’t function like open inventory in a well-run, well-positioned property that’s already near its ceiling. Median occupancy helps bring that into focus. It shows where the bulk of the market actually operates. And right now, that’s within striking distance of what most would consider full. In practical terms, that last stretch—from the low to high 90s—isn’t just about filling beds. It’s the hardest part of the curve. It takes more time, more operational change, and in some cases, significant investment to reposition. That’s the gap between capacity on paper and capacity in practice.
Why This Changes the Way We Think About Growth
If the typical property is already operating near its limit, it naturally shifts how growth shows up across the future of senior housing. For operators, it sets a different baseline. Pushing occupancy from 85% to 90% is one kind of challenge. Moving from 92% to 95% is another entirely. It’s incremental, harder won, and often tied to very specific levers like service or facility quality and overall reputation.
For investors looking across senior housing portfolios, it changes how opportunity is framed. High occupancy markets may not offer easy upside through filling vacant units, but they often signal strong demand fundamentals. Lower occupancy, on the other hand, isn’t always a demand story—it often requires a closer look at the asset itself.
For developers, it sharpens the question of where new supply makes sense. If a significant share of a market is already operating near practical capacity, the focus shifts from “Is there demand?” to “Where is demand not being met by the existing product?” Across all three perspectives, the message is consistent: vacancy alone doesn’t tell you where the opportunity is.
A Shift Toward Asset-Level Reality
There’s another layer to this that’s starting to come through in the data. The industry conversation has long centered on demand. Today, that question is settled, and the five-to-ten-year outlook for demand from an aging population is upon us. What’s becoming more important is how that demand is distributed, and which communities are best positioned to capture it—another evolving component of senior living market trends.
When you look at occupancy through that lens, a pattern starts to emerge. A large portion of properties are operating near their natural limits. At the same time, a smaller group continues to trail behind. That gap isn’t random. It often comes down to the fundamentals of the asset such as location, design, age, price point, and how well it’s being run.
In other words, the story is becoming less about whether demand exists and more about where it shows up. That has real implications. Strong properties are getting stronger, operating closer to capacity. Others may require reinvestment, repositioning, or operational change to achieve the occupancy gains that the typical well-run, quality senior living community has already experienced.
The Value of Long-Term Perspective
These kinds of shifts are easier to see with context. This year marks two decades of data and analysis from NIC, and that longer view helps separate short-term movement from more durable trends. Metrics like median occupancy may not have always been front and center, but they become more meaningful when tracked over time.
Looking across that history, what stands out isn’t just where occupancy is today, it’s how the center of the market behaves across cycles. And right now, that center is moving back toward levels that have historically aligned with full utilization—reinforcing broader market trends in senior living.
A Clearer Read on Senior Living Market Trends
At its core, this is about seeing the market more clearly. Senior housing occupancy still matters. It always will. But how we interpret it matters just as much. Total occupancy tells one story. Median occupancy tells another, and right now, it may be the more revealing of the two.
It shows a market where the typical property is already operating near capacity and some metros as a whole already are, where remaining vacancy is unevenly distributed. And where the next phase of performance will depend less on broad demand and more on asset-level execution. For operators, investors, and developers alike, that’s a meaningful shift. Because once you start to see capacity not just as a number, but as something shaped by real-world constraints, strategy tends to change with it.