Senior Living Investments Trend
Published Date: February 14, 2026
Senior housing transaction investment activity has entered a new phase—one defined not only by growing dollar volume, but also by rising price-per-unit metrics that reflect increasingly selective capital deployment. Over the past two years, transaction trends have pointed to renewed depth in the market, yet a closer look reveals that momentum is not evenly distributed. Instead, pricing and activity are being shaped by asset quality, buyer scale, and the cost of capital dynamics more than broad market forces. These senior living investment trends point to renewed capital engagement, but also show a market that is becoming more segmented by asset quality and buyer profile.
As NIC MAP marks 20 years of tracking senior housing and care real estate, the latest transaction data underscores a recurring lesson from two decades of market observation: industry averages matter, but segmentation matters more. The current environment illustrates this clearly, with headline growth masking widening gaps between asset classes and buyer profiles.
Rising Transaction Volume and Price-per-Unit Signal Capital Re-Engagement
Nationally, senior housing transaction investment volume has expanded for the second consecutive year, reaching more than $15.6 billion in 2025 on a rolling four-quarter basis, the highest level recorded in the past eight years. This sustained increase reflects a meaningful expansion in capital allocation to the sector, driven by improved pricing clarity and greater conviction around long-term fundamentals.
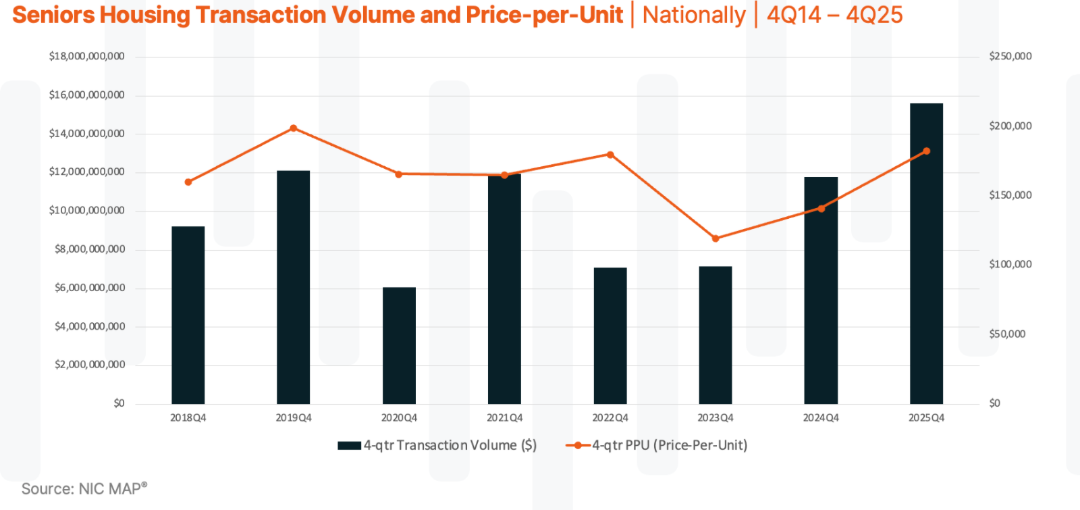
At the same time, price-per-unit (PPU) metrics have risen in back-to-back years, surpassing $180,000 per unit nationally. From a historical perspective, this places pricing back in line with longer-term norms observed before the pullback in 2023. Importantly, the rise in PPU alongside growing transaction volume suggests that capital is not simply flowing into lower-priced or distressed opportunities—it is underwriting premium assets with greater confidence. For investors and lenders, this combination of higher volume and higher pricing reflects a market where transaction activity is scaling alongside valuation discipline. Nonetheless, these top-line figures tell only part of the story.
Averages Are Rising, but the Market Is Fragmenting
While national averages point upward, transaction data reveals a market increasingly defined by fragmentation rather than uniform movement. Rising PPUs are not the result of across-the-board appreciation; instead, they are driven by specific cohorts of assets commanding a disproportionate share of capital.
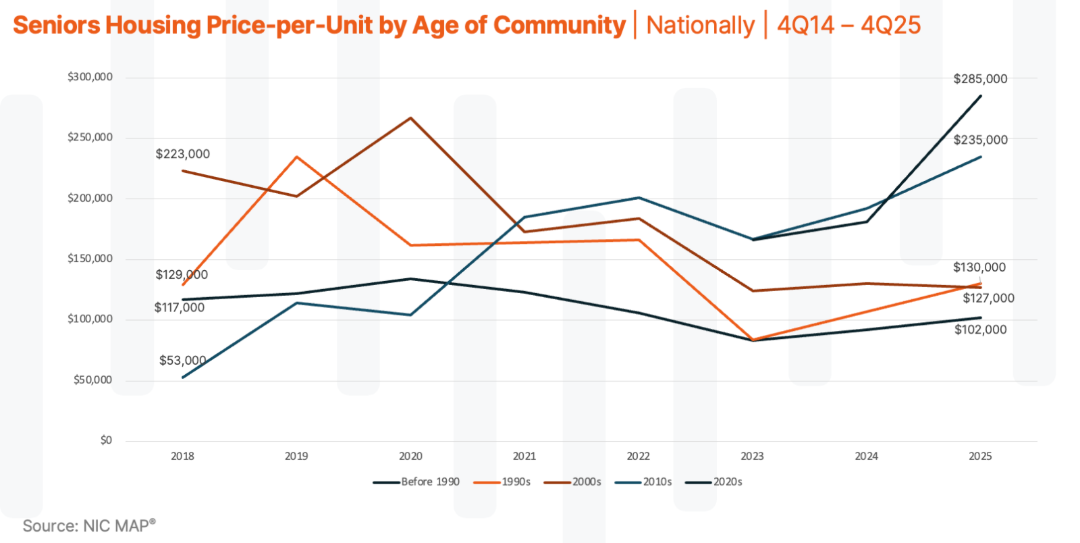
Age of property offers a useful proxy for asset quality and classification. When viewed through this lens, the bifurcation becomes clear. The increase in industry-wide PPU is largely attributable to newer properties opened within the last 15 years, with communities delivered since 2020 posting the most pronounced gains. These assets are benefiting from modern design, competitive operating profiles, and alignment with current consumer expectations. Capital is not just paying more—it is choosing more carefully.
By contrast, properties opened prior to 2010 saw only modest PPU increases over the same period. While pricing for older assets has improved from levels observed two years ago, the slope of that improvement remains comparatively flat. The widening delta between newer and older inventory illustrates how capital is differentiating between asset profiles within the same market. That distinction matters.
This divergence reinforces a broader takeaway: senior housing investment is not behaving as a single asset class. Capital is increasingly selective, rewarding assets perceived to offer durability, efficiency, and long-term relevance.
The Recovery Is Asset-Led, Not Market-Led
Transaction trends over the past several years point to an environment where pricing acceleration is being pulled forward by specific asset cohorts rather than lifted evenly by macro conditions. Higher-quality, newer inventory is setting the pace for valuation benchmarks, while older assets continue to transact at discounts that reflect operational and capital considerations.
This asset-led dynamic has important implications. First, it suggests that pricing signals should be interpreted carefully—headline increases may overstate momentum for segments that are not directly participating in those gains. Second, it highlights how competitive positioning at the asset level has become central to transaction outcomes.
The resulting gaps between asset classifications are not temporary anomalies; they are structural realities of how capital is underwriting risk, longevity, and adaptability. Over time, these deltas are likely to remain a defining feature of senior housing transaction investment. Insights like these are explored in greater detail in NIC MAP’s Transaction Monitor, which provides subscribers with deeper segmentation by asset characteristics to better understand where pricing strength is concentrated.
Scale and Cost of Capital Are Reasserting Their Influence
Buyer behavior has also played a central role in shaping recent transaction trends. A clear split has emerged between public and private buyers, with large public healthcare REITs—including Welltower and Ventas—helping drive higher PPUs across the market.
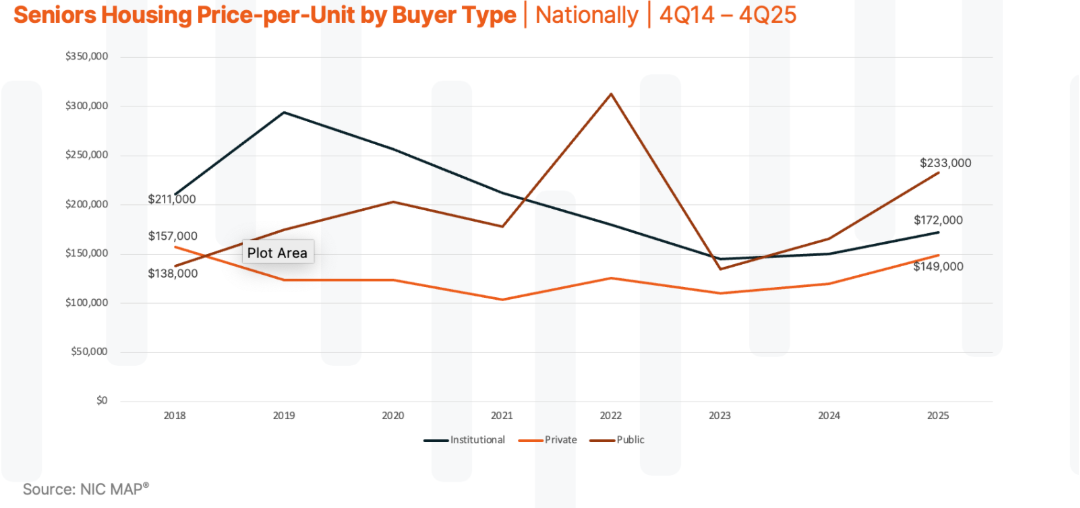
These buyers bring structural advantages that influence how pricing is established in the market. Lower cost of capital, greater balance sheet flexibility, and a higher tolerance for short-term NOI variability can enable scaled public buyers to compete at pricing levels that are more difficult for many private investors to support. As a result, they are often active in transactions involving newer assets and higher-quality portfolios, where pricing expectations are elevated.
This does not diminish the role of private capital. It simply underscores how buyer composition is shaping valuation outcomes today. In today’s environment, who sets pricing depends less on risk appetite and more on capital structure and scale. Over 20 years of transaction tracking, NIC MAP has consistently observed how shifts in capital markets reshape transaction behavior. The current cycle is another example of that long-standing relationship between financing conditions and real estate pricing.
Acquisition Has Become the Primary Re-Entry Point to the Sector
With development economics remaining constrained, acquisition activity has emerged as the most accessible path for capital seeking exposure to senior housing real estate. Rising transaction volume and PPU trends suggest that investors are increasingly finding relative value in existing assets, particularly those that align with current operating and capital expectations.
This preference reflects a desire for certainty. Acquisitions offer defined operating histories, established market positions, and clearer underwriting parameters compared to ground-up development. As a result, transaction activity has become a popular mechanism through which investors re-engage with the sector.
Looking Ahead: What Transaction Trends Are Signaling
Senior housing transaction activity continues to scale, but the most important signals are no longer found in headline averages alone. Rising transaction volume and price-per-unit reflect a market that is active and increasingly selective—one where asset quality, buyer scale, and capital structure are shaping outcomes more than broad market conditions. For investors and lenders, the challenge is not simply understanding where pricing is today but understanding why it is being set where it is.
This is where granularity becomes essential. National trends provide context, but pricing decisions ultimately happen at the property level. Asset type, vintage, location, buyer profile, and deal structure all influence valuation outcomes, often in ways that are not immediately visible in top-line metrics. As transaction spreads widen across asset classifications, identifying truly comparable transactions has become a critical input for acquisition underwriting.
In practice, that is where many underwriting assumptions are now being tested. NIC MAP’s transaction data is designed to support that level of precision. Subscribers have access to property-level transaction information that allows them to identify and evaluate comparable sales based on asset characteristics, geography, property type, buyer type, and other defining factors. This depth of insight enables investors to move beyond generalized benchmarks and anchor pricing decisions in outcomes that reflect how similar assets are actually trading in the market.
As NIC MAP marks 20 years of tracking senior housing and care real estate, the value of longitudinal, property-level data has never been clearer. Taken together, these senior living investment trends reflect a market that is active, liquid, and increasingly selective—where understanding asset-level drivers matters more than tracking averages.