NIC MAP Fourth Quarter 2024 Key Takeaways
March 18, 2025
Updated: May 1, 2026
Senior Housing Occupancy Continues Climbing in 4Q 2024
The NIC Analytics team presented findings during a webinar with NIC MAP clients on January 23rd to review key senior housing data trends during the fourth quarter and full year 2024.
Additionally, Chris Bird, CEO of LCS, joined Lisa McCracken, NIC’s Head of Research, for a conversation on outlook, growth, and strategy for owners and operators in the senior housing industry in the year ahead.
Key takeaways included:
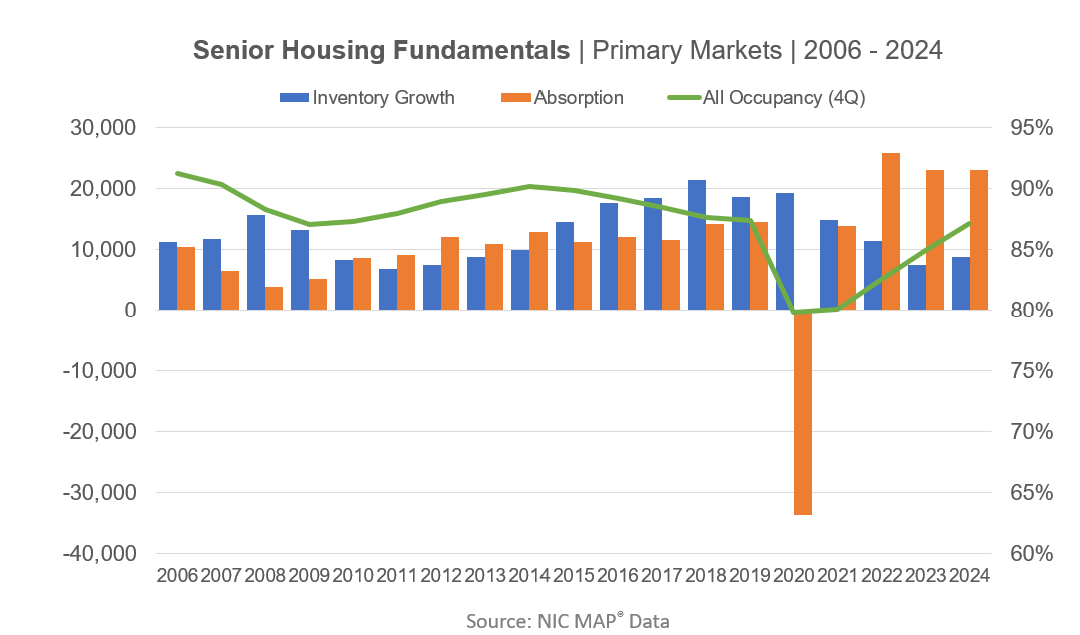
Takeaway #1: Occupancy Rate Continued Climbing
- The occupancy rate for the 31 NIC MAP Primary Markets rose 0.7 percentage points to 87.2% in the fourth quarter, gaining 2.2 percentage points for the full year 2024.
- Occupancy increases were driven by another year of robust demand as 2024 net absorption was roughly in line with 2022 and 2023 levels.
- Inventory growth in 2024 was slightly higher than 2023 but overall remained low and near levels last seen in 2013.
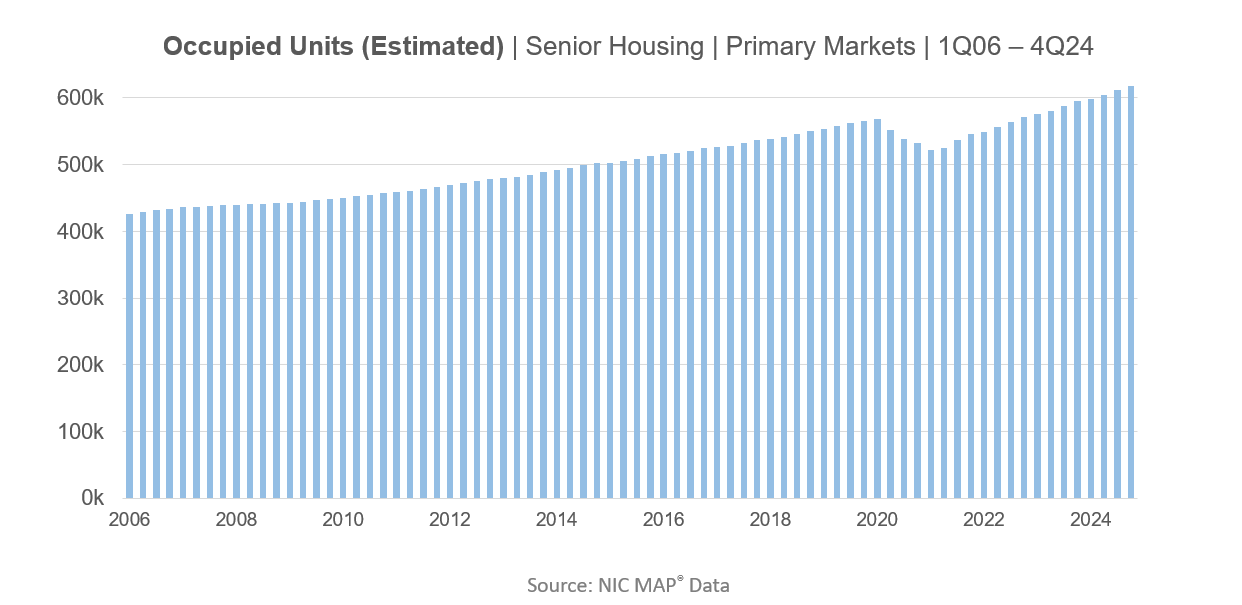
Takeaway #2: Occupied Units Reached New Record High
- The total number of occupied senior housing units hit another record high in 2024, rising to more than 618,000 units for the 31 Primary Markets in the fourth quarter.
- The Secondary Markets had a similar trend, reaching a record high of more than 335,000 units.
- These record highs speak to the robust consumer demand for senior housing units.
Takeaway #3: Senior Housing Units Under Construction Least Since 2014
- In construction trends, for both Majority Independent Living and Majority Assisted Living properties, the number of units under construction in 2024 continued to decline, falling to levels last seen in 2014.
- This decline may reflect ongoing headwinds to development such as access to capital, cost of capital, and construction costs.
Takeaway #4: Construction Starts Declined for Third Consecutive Year
- Senior housing construction starts also remained depressed in 2024, with the fewest units breaking ground in the 31 Primary Markets since 2009 during the depths of the Global Financial Crisis.
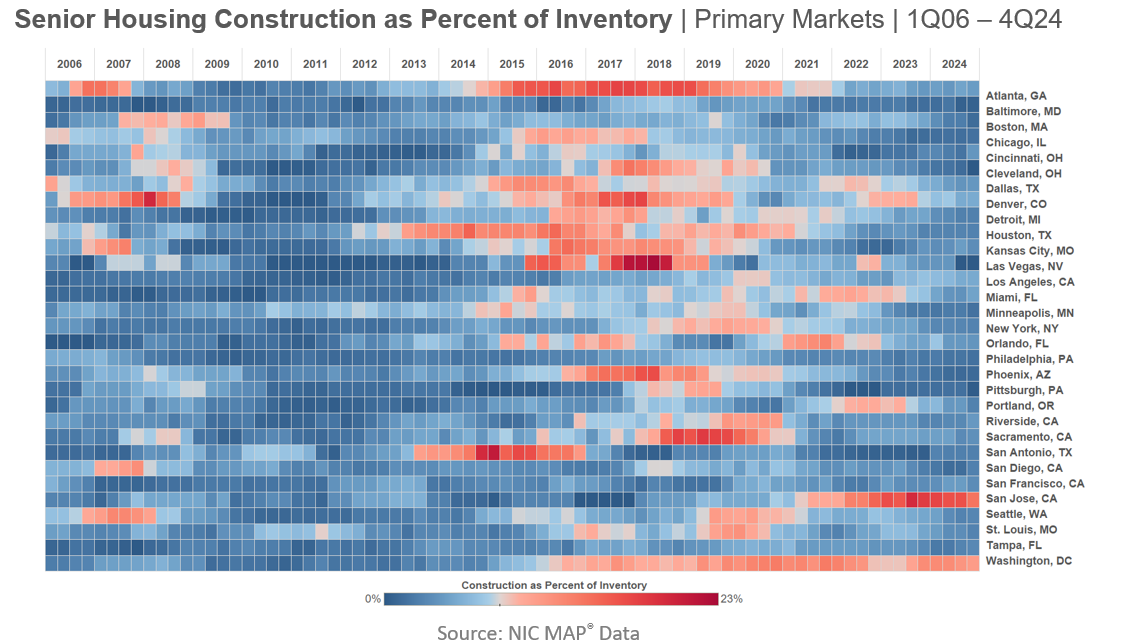
Takeaway #5: Increasing Number of Markets with No Projects Under Construction
- By metro area each quarter, this heat map shows which markets had the most construction activity shaded in red, and the least construction activity shaded in blue.
- In 2024, an increasing number of the 31 Primary Markets reported no projects underway, rising from one to four during the year.
Interested in learning more?
The data featured in this article derives from NIC’s analysis of NIC MAP’s Senior Housing Market Fundamentals Data Release. NIC MAP Vision clients with access to NIC MAP data also receive an exclusive invitation to a market fundamentals webinar led by NIC’s Research team where they review each quarter’s trends in context with historical data and current events. To get a better idea of what’s covered, watch an abridged version of the webinar. To learn more about NIC MAP data, powered by NIC MAP, and accessing the data featured in this article, schedule a meeting with a product expert today.