See what the market is charging and how it’s performing right now
Foundational data to help make the right decisions
Understanding what the market is charging and how it’s performing are foundational to every senior housing decision from pricing adjustments to underwriting to portfolio strategy.
Current data that answers your top questions
When teams ask “What are rates in the market?”, “What’s occupancy looking like?”, or “What are pricing trends over time?”, they need current, granular data, not outdated surveys or anecdotal broker insight.
NIC MAP provides the consistent, granular market intelligence teams need to act with confidence.
Real-time visibility into market rate and performance
Understanding senior housing market performance requires more than knowing today’s asking rate. Teams need to see average rates, pricing ranges by unit type, occupancy levels, and how rates and occupancy are trending over time.
NIC MAP delivers aggregated and property-level rate and occupancy intelligence in one platform so you can:
Understand current market rates
Monitor occupancy performance
Track pricing trends over time
Compare your property to market averages
Turn rate and occupancy data into actionable market insight
Senior housing revenue and performance are directly tied to local pricing power and demand balance. Yet many teams lack consistent visibility into real market conditions.
NIC MAP solves the core challenges decision-makers face.
Limited visibility into true market rates
See average rates and pricing ranges by care level and unit type.
Unclear occupancy performance
Understand occupancy by care segment, unit type, and submarket.
Difficulty tracking trends over time
View quarter-over-quarter and year-over-year rate and occupancy changes.
Incomplete competitive pricing insight
See what competitors are actually charging, including care fees and concessions.
Inability to benchmark assets or markets
Compare properties, PMAs, metros, and national performance.
The result: more confident pricing decisions, stronger underwriting assumptions, and clearer market positioning.
How NIC MAP supports rate and occupancy analysis
Understand current market rate and occupancy conditions
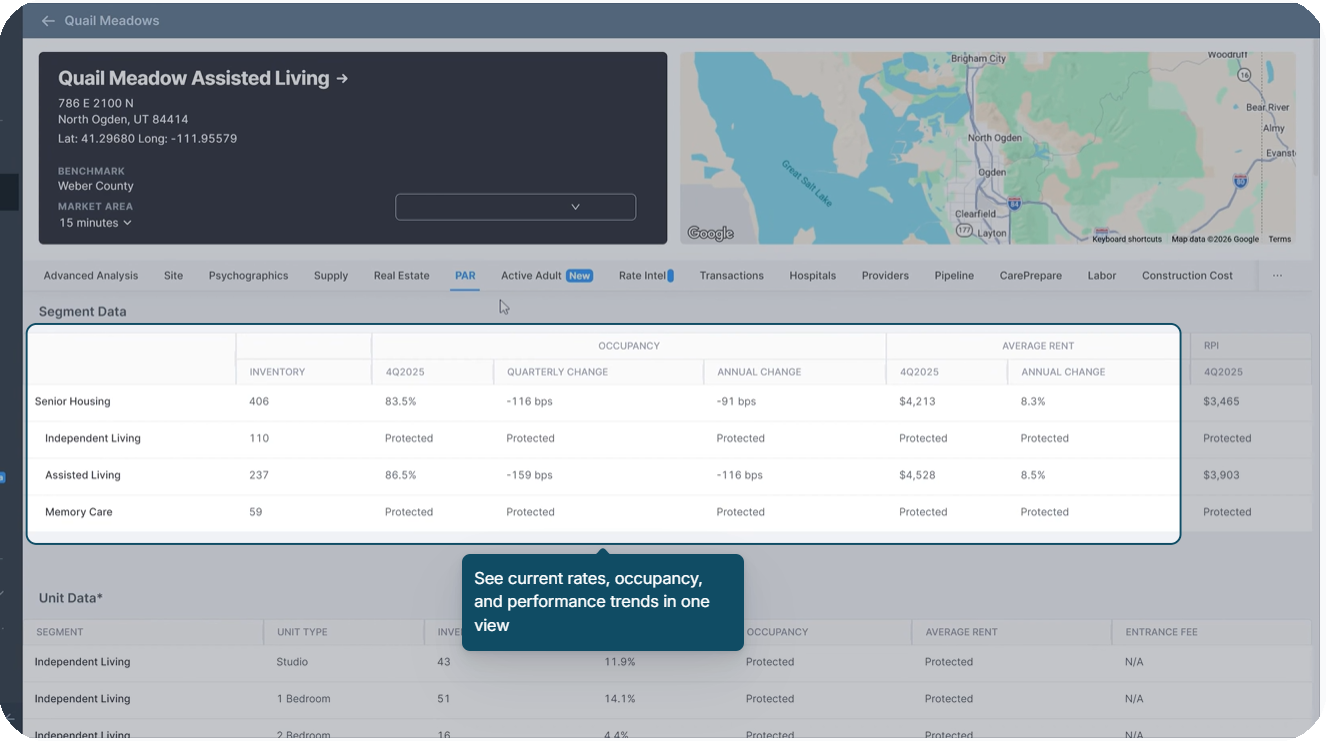
Property Advisor Report (PAR)
Viewing aggregated rate and occupancy by care segment and unit type shows what the market is charging today and how full competing properties are, establishing a factual baseline for pricing and performance decisions.
Use it for:
Pricing strategy, underwriting validation, portfolio monitoring
See what competitors are charging right now
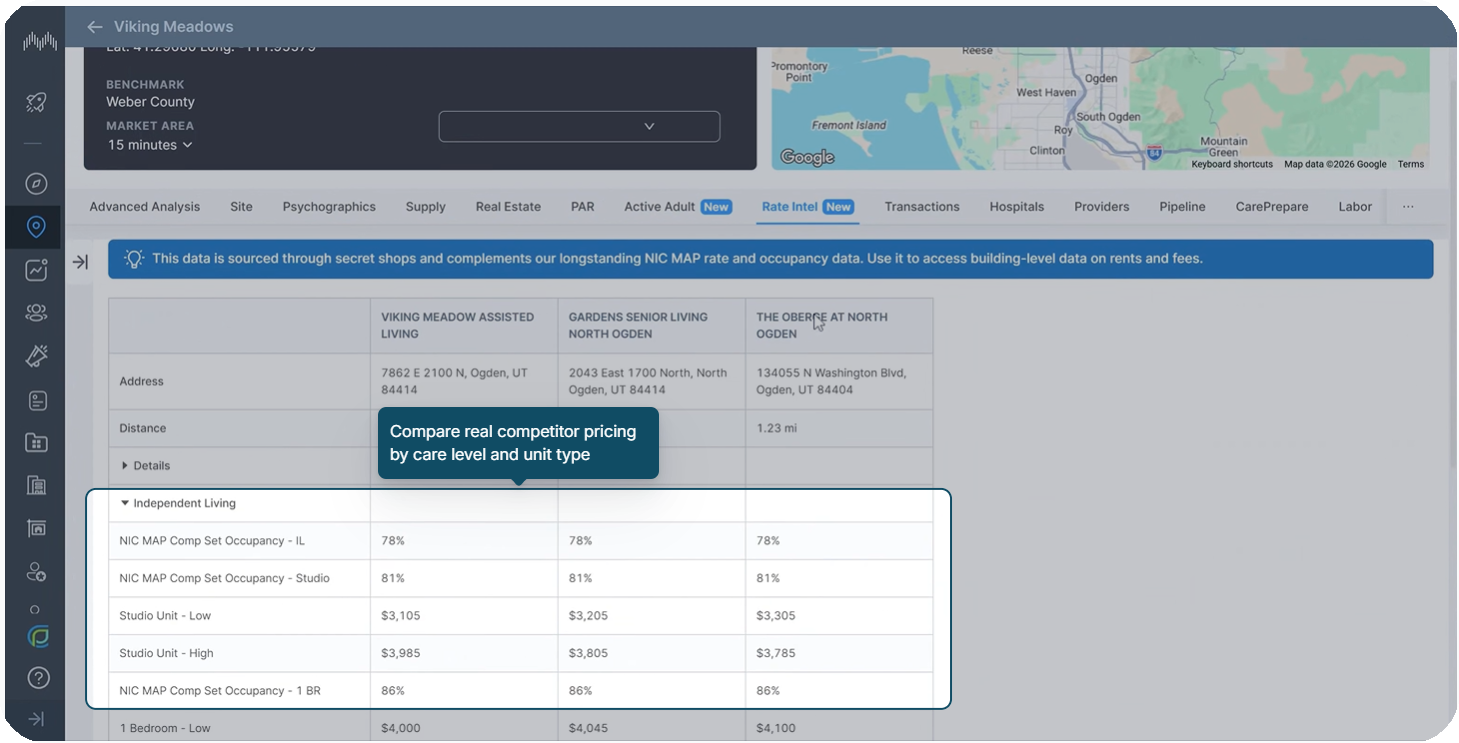
Rate Intelligence
Property-level asking rates, care fees, and concessions reveal real competitive pricing structures, allowing teams to adjust pricing, sales strategy, or underwriting assumptions based on current market behavior.
Use it for:
Competitive positioning, sales strategy, revenue modeling
Track how rates and occupancy are changing over time
Trends Module
Historical quarter-over-quarter and year-over-year trend data show whether market conditions are strengthening, softening, or stabilizing, supporting forward-looking pricing and investment decisions.
Use it for:
Monitoring market cycles, long-term planning, investment strategy
Benchmark local performance against broader markets
Market Comparison Tools
Comparing PMA, metro, and national pricing and occupancy data clarifies whether a local market is outperforming or underperforming broader benchmarks.
Use it for:
Portfolio strategy, expansion planning, risk assessment