Conversions, Closures, and the Future of Senior Housing: A Unique View from NIC MAP’s Latest Report
Part of NIC MAP’s Q2 2025 data release, a new report—Property Conversion and Closure Trends—offers insight into the long-term dynamics shaping senior housing and nursing care markets. Now available exclusively to subscribers, this report represents the only comprehensive effort in the industry to quantify how properties evolve over time across multiple dimensions (care level, campus structure, profit status, and inventory scale). Log in to the NIC MAP platform to see the Q2 data release and read this new report.
Demand metrics, occupancy trends, and labor challenges have dominated recent senior housing headlines. However, NIC MAP’s new report, Property Conversion and Closure Trends, explores the way properties are shifting and the nuances of the investor and operator response to a changing market.
In this post, discover how senior housing stakeholders are reassessing what repositioning, adaptability, and long-term strategy look like.
Tracking Property Conversions and Campus Shifts
One of the core assessments of the report centers on property conversions, which happen when a community changes its unit composition so that it has a different classification. For example, this happens when a property changes from Independent Living (IL) to Assisted Living (AL).
Properties have repositioned toward higher acuity
The report shows nearly 500 property type conversions since 2018, with the majority of these originating from communities that were previously majority IL. In fact, nearly 90% of previously IL communities converted to AL, reflecting a subtle shift toward higher acuity.
This suggests that operators have tried to reposition their offerings in response to changing resident needs, especially as acuity levels rise.
But this repositioning trend appears to be slowing. The number of property type conversions has declined year-over-year since its peak in the late 2010s. This slowdown may point to a maturing inventory base where the most opportunistic conversions have already occurred.
Takeaways:
- Operators: The slowdown in property type conversions may signal that prior repositioning efforts have already addressed the most viable opportunities. Instead of relying on repositioning, focus more on optimizing your operations for current resident care needs.
- Investors: Conversion-driven value creation is becoming less common. If you are pursuing new development or acquisition, you may need a sharper focus on underserved care segments.
Campuses have repositioned to offer more types of care
Another transformation quietly underway is campus type conversion. Since 2018, more than 750 properties have altered their campus designation, most often moving from Freestanding (providing a single level of care, such as dedicated memory care facilities or independent living communities) to Combined (might combine multiple types of care but do not offer the full spectrum of care found in Continuing Care Retirement Communities). Roughly 90% of properties originally classified as Freestanding transitioned into Combined campuses.
While this trend also shows signs of tapering in recent years, it speaks of a broader strategic response among providers: Build a care continuum into your community.
Takeaways:
- Developers and design consultants: Conceptualize new developments with adaptable layouts that can handle multiple care levels to see higher ROI.
- Operators: Combined campuses introduce greater complexity for staffing, licensing, and service delivery. But they also promise longer lengths of stay and improved resident transitions. You may face new challenges in workforce training and operational coordination, but you’re better positioned to retain residents through changes in acuity.
Understanding Unit Removals and Market Adjustments
Beyond conversions, the report introduces another equally critical trend: unit removals through property closures or inventory reductions.
A unit removal refers to properties that have either closed permanently or have been disqualified from NIC MAP’s inventory due to a shift away from market-rate senior housing or nursing care. Note: The report differentiates between unit reductions within existing properties and entire property removals, with both included in NIC MAP’s accounting of inventory change.
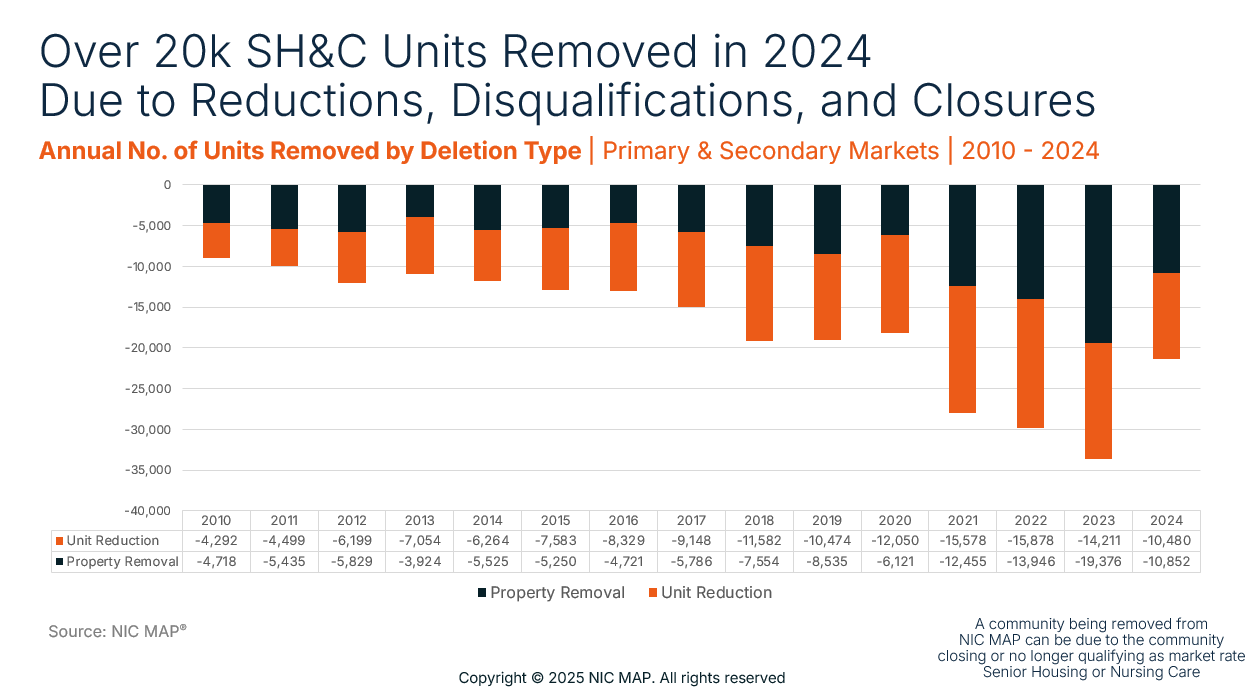
The chart above provides a detailed look at the volume and timing of unit removals. More than 200,000 units have been removed from Primary and Secondary market inventories since 2015, with the majority occurring in just the last three years.
The years 2021 to 2023 saw a notable acceleration, likely representing a delayed reaction to the pressures and disruptions of the pandemic era. Whether due to operational insolvency, shifts in reimbursement models, or aging infrastructure, the sector saw a noticeable drop in the number of properties available.
Yet 2024 shows signs of stabilization. The number of unit removals and closures appears to have normalized to levels more in line with pre-pandemic patterns. This could reflect a natural rebalancing of supply after several years of high unit reduction across the industry.
Where are these closures happening? Primary markets have led the count, particularly in higher-barrier metros such as Boston, New York, and Los Angeles. This is not altogether surprising. Markets with higher labor costs, regulatory complexity, and aging infrastructure may be more vulnerable to closure or disqualification
Takeaways:
- Investors and developers: The metro-level breakdown in the report provides valuable guidance on where the inventory pipeline is tightening, and where there may be unmet demand as a result.
- Operators: Use closures to benchmark operational resilience — why did others exit and what kept you afloat?
Conversion and Closure Dimensions are Essential Data
Taken together, these findings indicate that the senior housing and care sector is dynamic. Inventory is not only shaped by new construction and absorption, but also by the ongoing redefinition of what care environments need to look like.
Conversions and closures are often overlooked, but they’re essential dimensions of how the market evolves in response to demographics, consumer preferences, and systemic events.
While the pace of change may be slowing, the report’s data strongly suggests that the industry has undergone a quiet, structural transformation in recent years. This makes the insights in the Property Conversion and Closure Trends report particularly valuable. They provide clear data to act on at a time when many providers and capital partners are seeking durable footing in a post-pandemic landscape.
For NIC MAP subscribers, this new report is a unique resource that delivers insights that you can’t find anywhere else on the platform. Its longitudinal approach, detailed classification logic, and clear demarcation between types of conversion and removal make it one of the most comprehensive reference points for understanding the movements in senior housing.
For those looking to deepen their understanding of local dynamics or benchmark repositioning and closure activity, this report offers the tools to do so with precision and clarity.
Explore the full Property Conversion and Closure Trends report and its implications for your market or portfolio by logging into the NIC MAP platform.
Not yet a subscriber? Explore how NIC MAP’s data and tools will help you make strategic decisions: